WHY Dashboard
The product & project management platform where every initiative is tracked by the
seven questions that actually matter — WHY, WHAT,
WHO, WHERE, WHEN, HOW and
STATUS — with a dated update log behind every row.
One grid. Every answer.
WHY Dashboard was born from the RAID-log spreadsheet that executive teams use to run reviews: a hierarchy of Initiatives, each holding rows of work. But instead of a spreadsheet that drifts out of date, every cell lives in a live, multi-user web grid — and every row keeps a dated log of updates that tells the story of how it got where it is.
A single row answers the seven questions at a glance: WHY it exists, WHAT the work is, WHO owns it, WHERE it lands, WHEN it is due, HOW it will be done, and its current STATUS — color-coded by health so a whole portfolio reads in seconds. When a due date or status changes, WHY Dashboard writes the change to the row's log automatically, and every manual update is stamped with a date and an author byline.
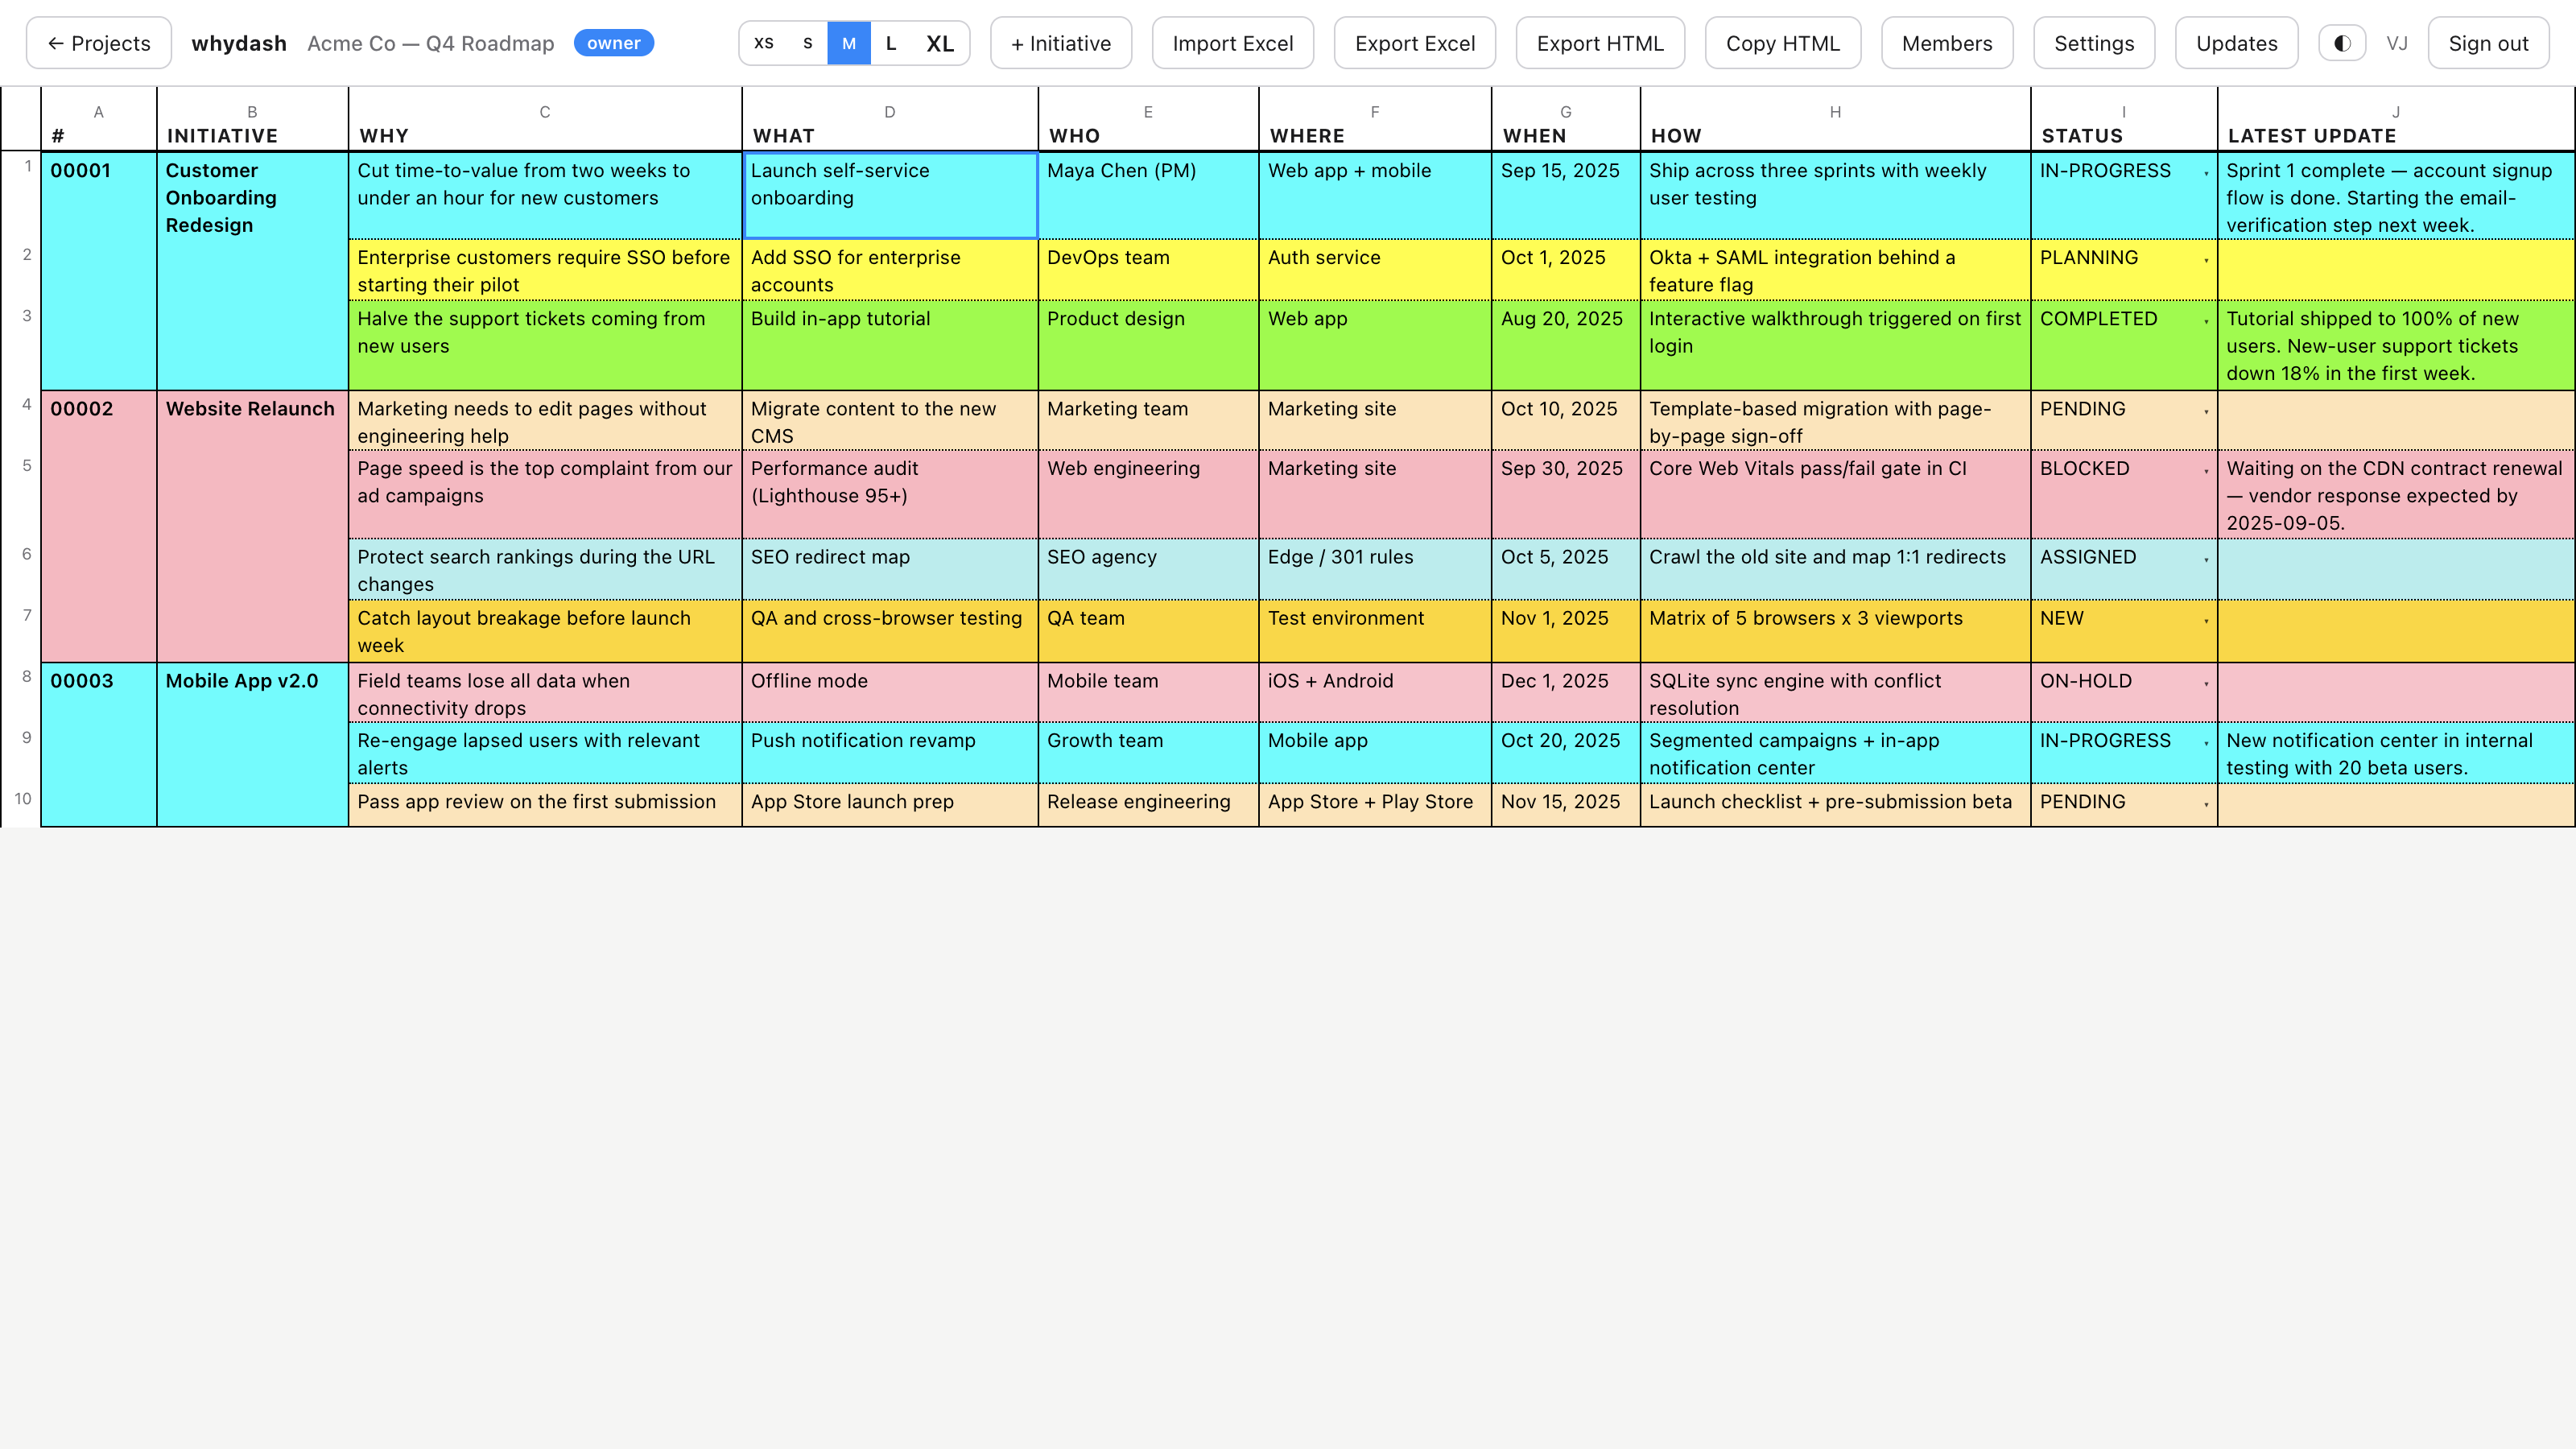
The dashboard. Three initiatives, ten rows, and the state of the whole quarter in one view — status-driven tints, initiative grouping, and the latest update for every row.
Features built for reviews, not just roadmaps
Everything on this page is in the product today. No mockups — these are the controls your team will click.
Seven-question structure
Every row carries WHY / WHAT / WHO / WHERE / WHEN / HOW / STATUS, so work is never scheduled without its rationale and owner.
Inline, spreadsheet-style editing
Double-click any cell to edit. Tab, arrows and Enter navigate the whole grid — no modal fatigue, no lost focus.
No horizontal scrolling
Columns reflow and wrap at any window size and any of the five font sizes (XS–XL). The grid always fits the screen it is shown on.
Dated update log per row
Each row keeps its own running log of updates — newest first, with author bylines and timestamps — so "what happened since the last review" is one click away.
Row history & audit trail
A History tab records the previous value of every field and who changed it. Automatic change records capture every WHEN and STATUS edit, read-only and tamper-evident.
Perpetual WHEN calendar
The date picker navigates any AD year from 1 to 9999 — plan 2026 milestones without leaving 2025, and set "TBD" with one click.
Weighted, color-coded statuses
Fourteen built-in statuses (NEW → COMPLETED, plus BLOCKED, AT-RISK, ON-HOLD…) each carry a health weight and a tint. Customize the catalog per project.
Excel & HTML import/export
Import an existing RAID-log .xlsx and it maps to the grid; export back to
XLSX or a standalone HTML document; or Copy HTML for a single row into any report.
JSON backup & restore
Every project exports to a portable JSON backup and can be restored as a new project or in place. Your data is never locked in.
@mentions & email alerts
Tag a teammate with @username in any cell or update and they get an email
the moment it is saved.
Roles, seats & invitations
Owner, collaborator and guest roles per project, team seat bands up to 10,000, email invitations, and last-owner protection so a team can never lock itself out.
Conflict-safe concurrency
Every project carries a version stamp; simultaneous edits are detected and reconciled with optimistic concurrency — no silent overwrites.
A closer look
Four screens from the application interface, shown with sample data.
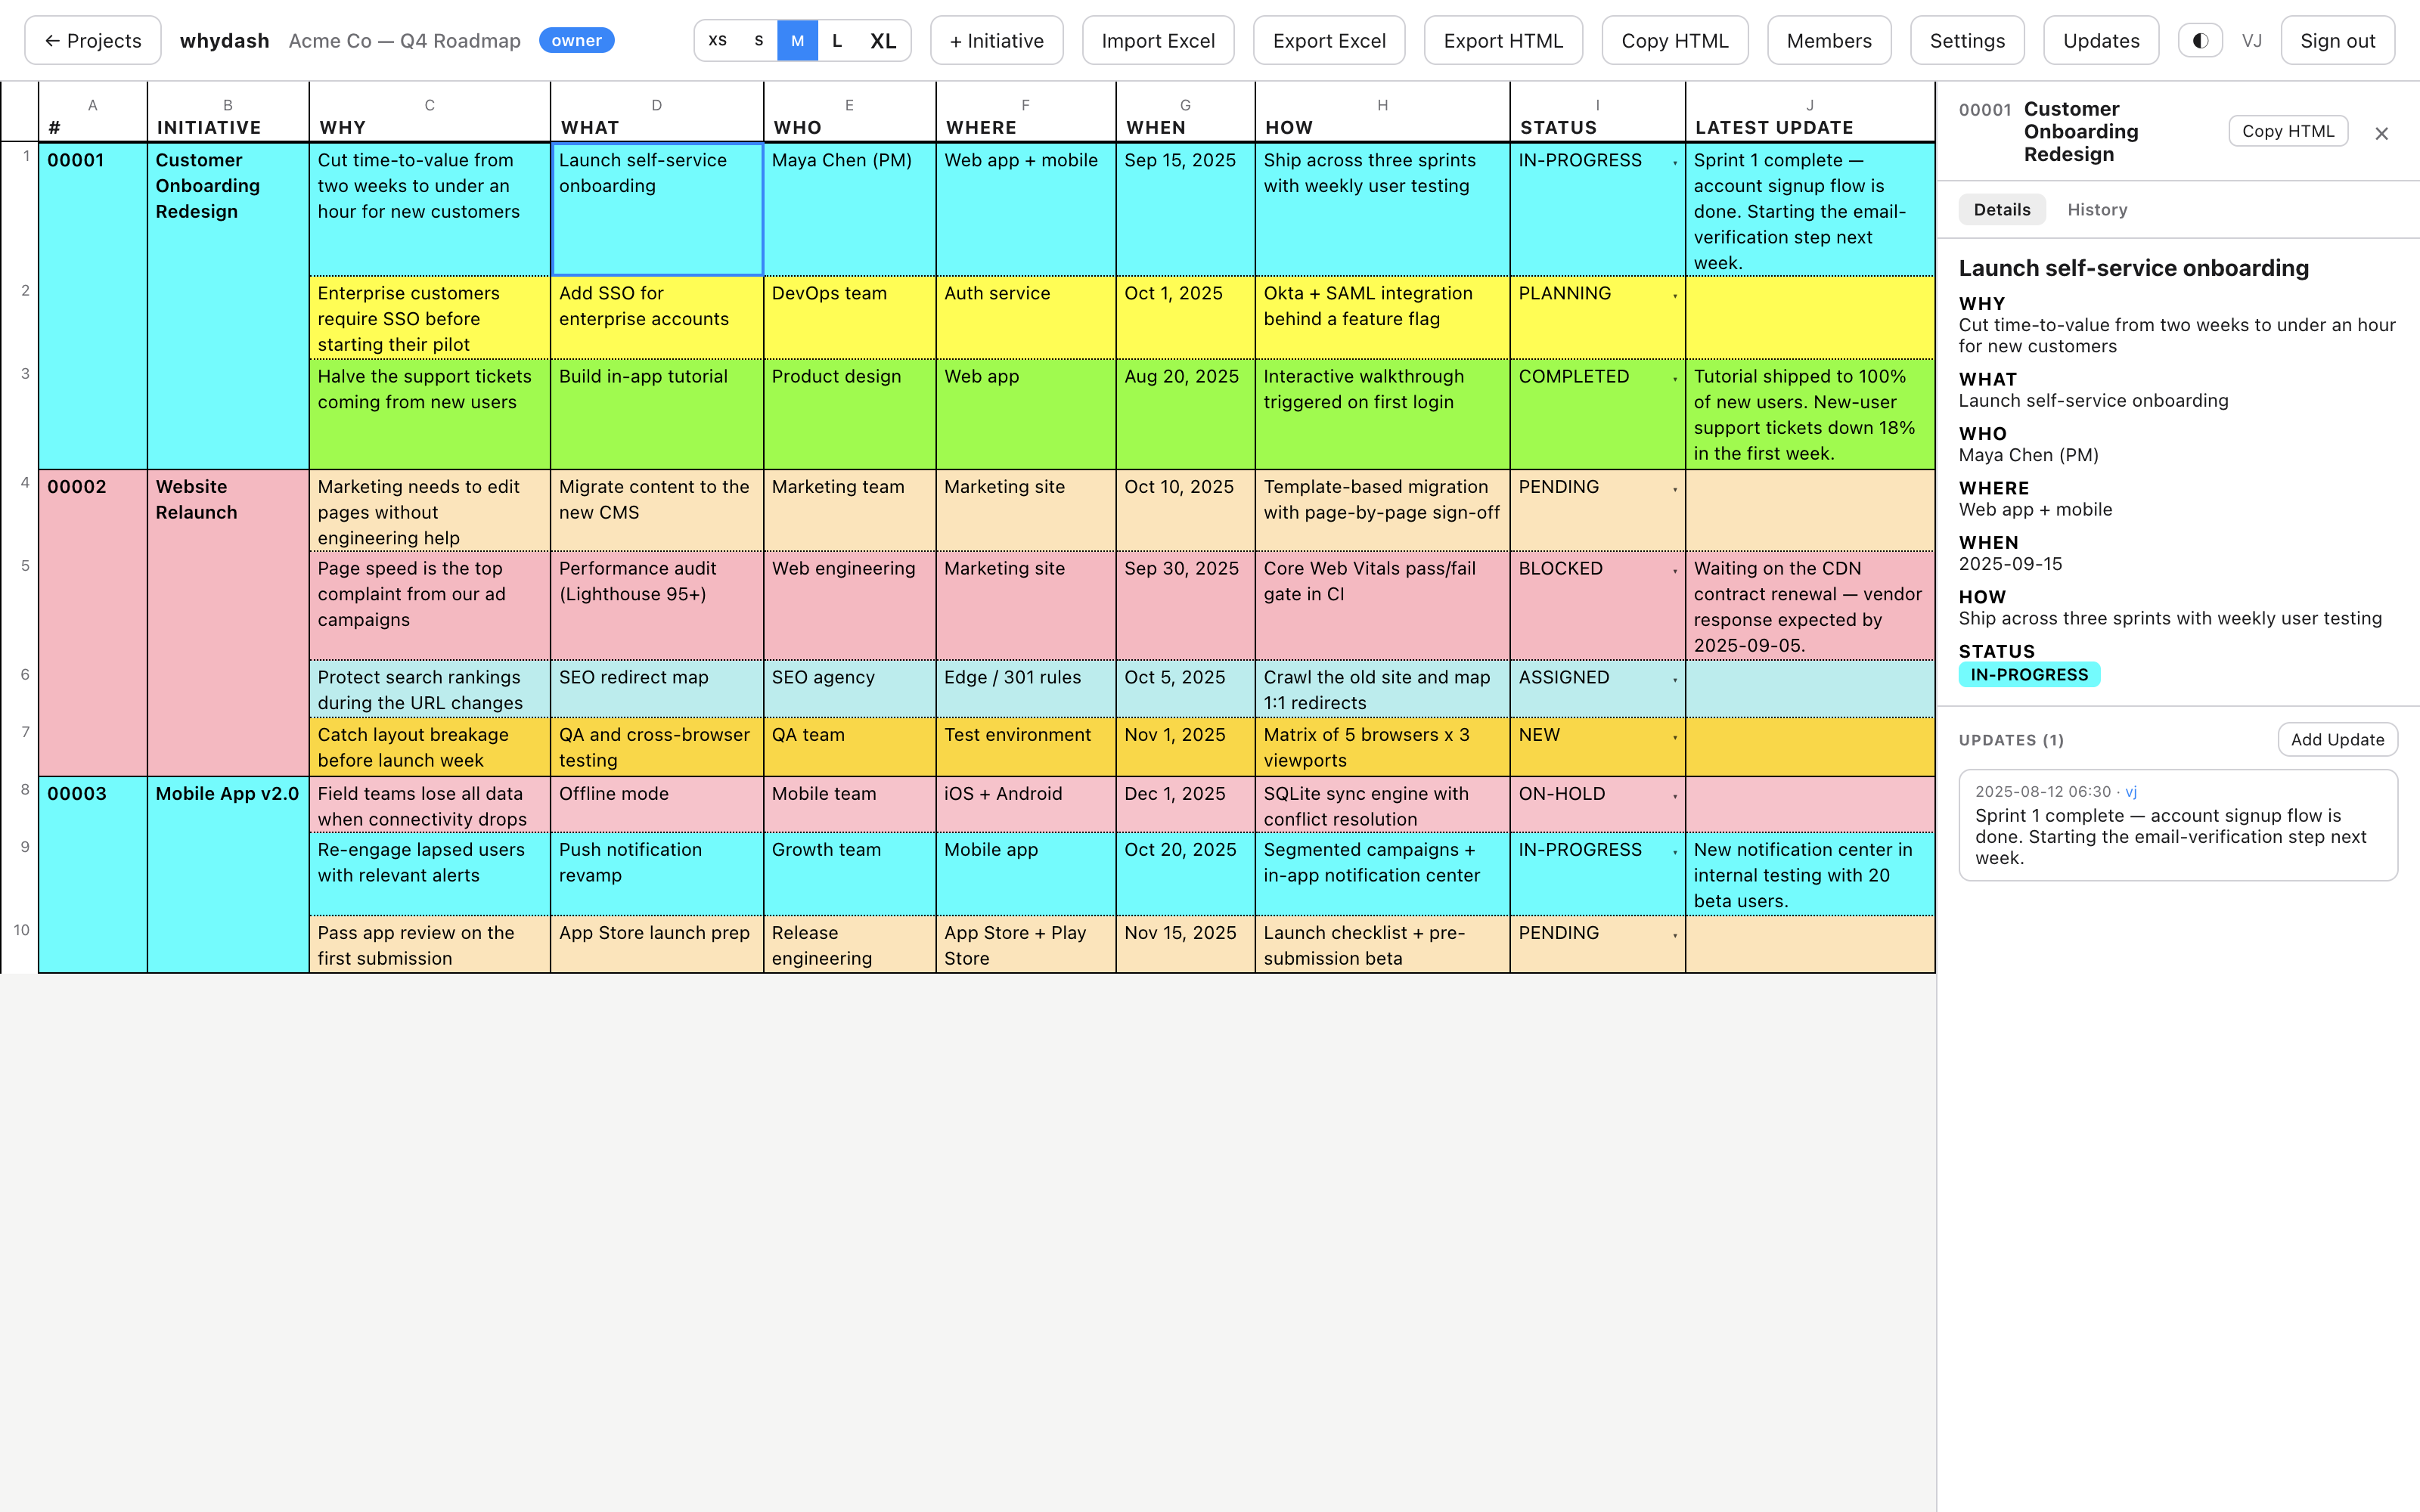
Every row keeps its story. The inspector shows all seven fields, the row's full update log with author bylines, and a History tab auditing every prior value.
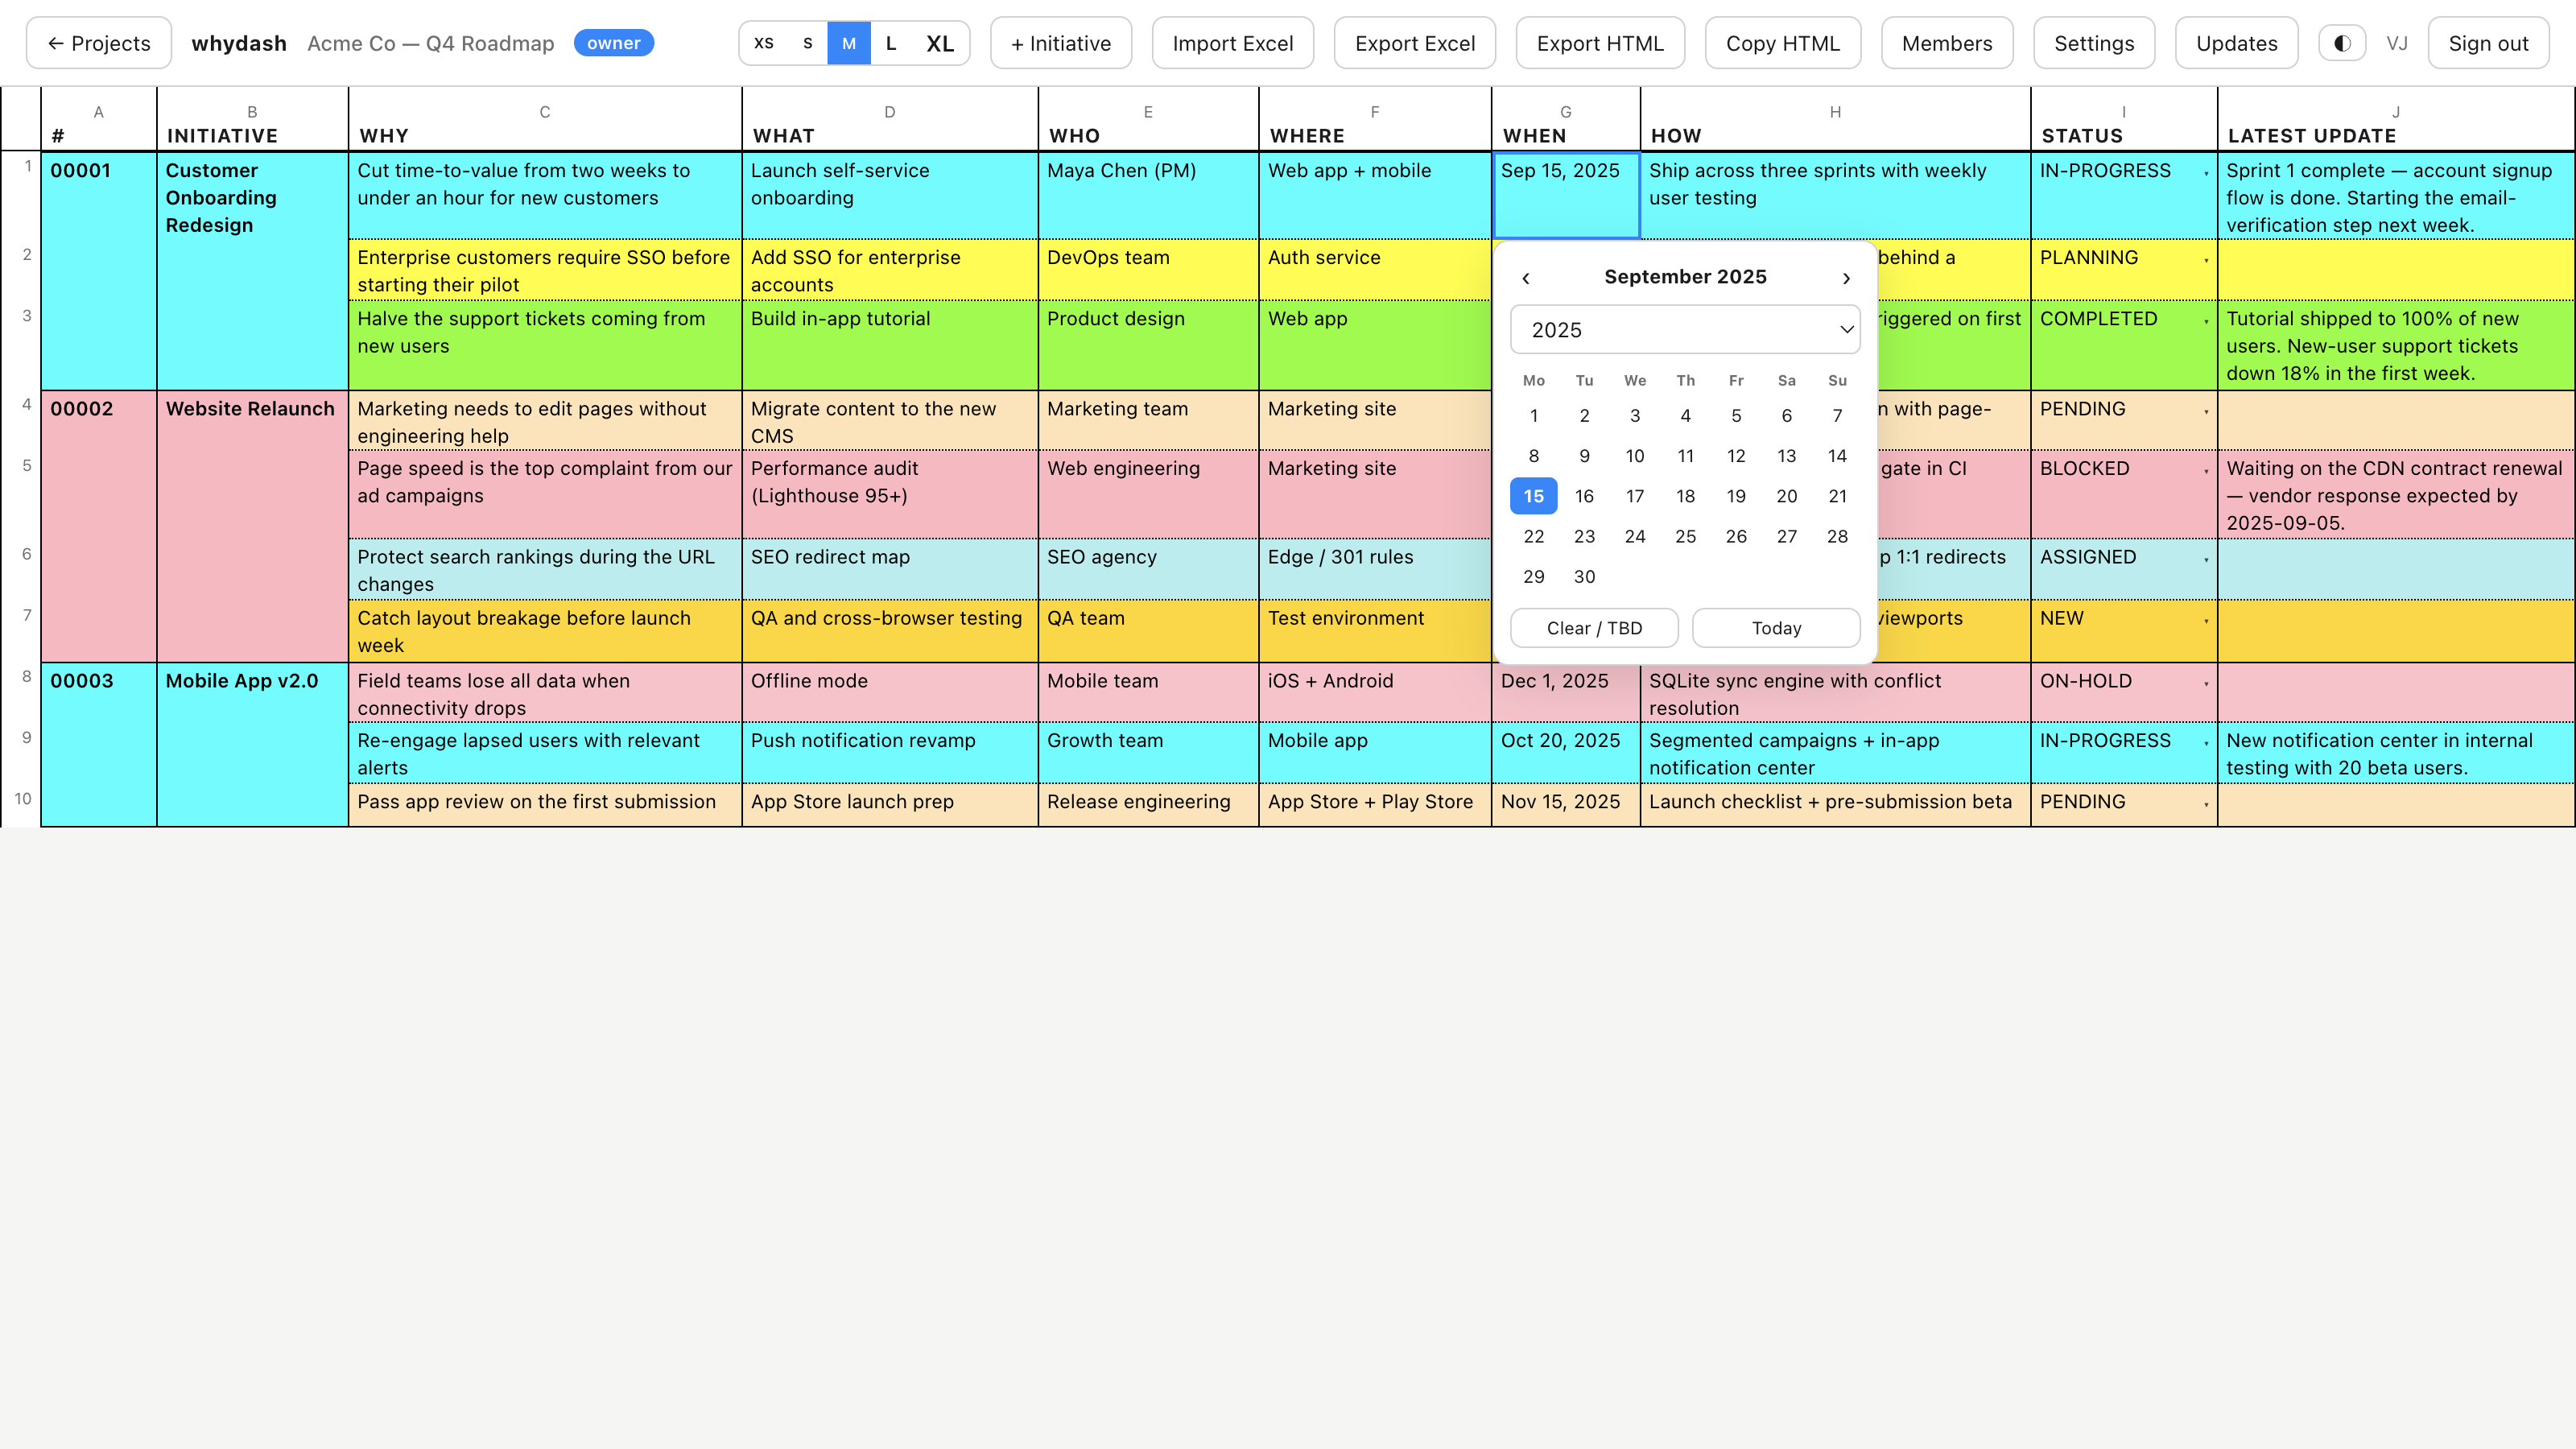
The perpetual calendar. Double-click a WHEN cell: pick a day, jump any year with the dropdown, or clear it to TBD — no decade traps.
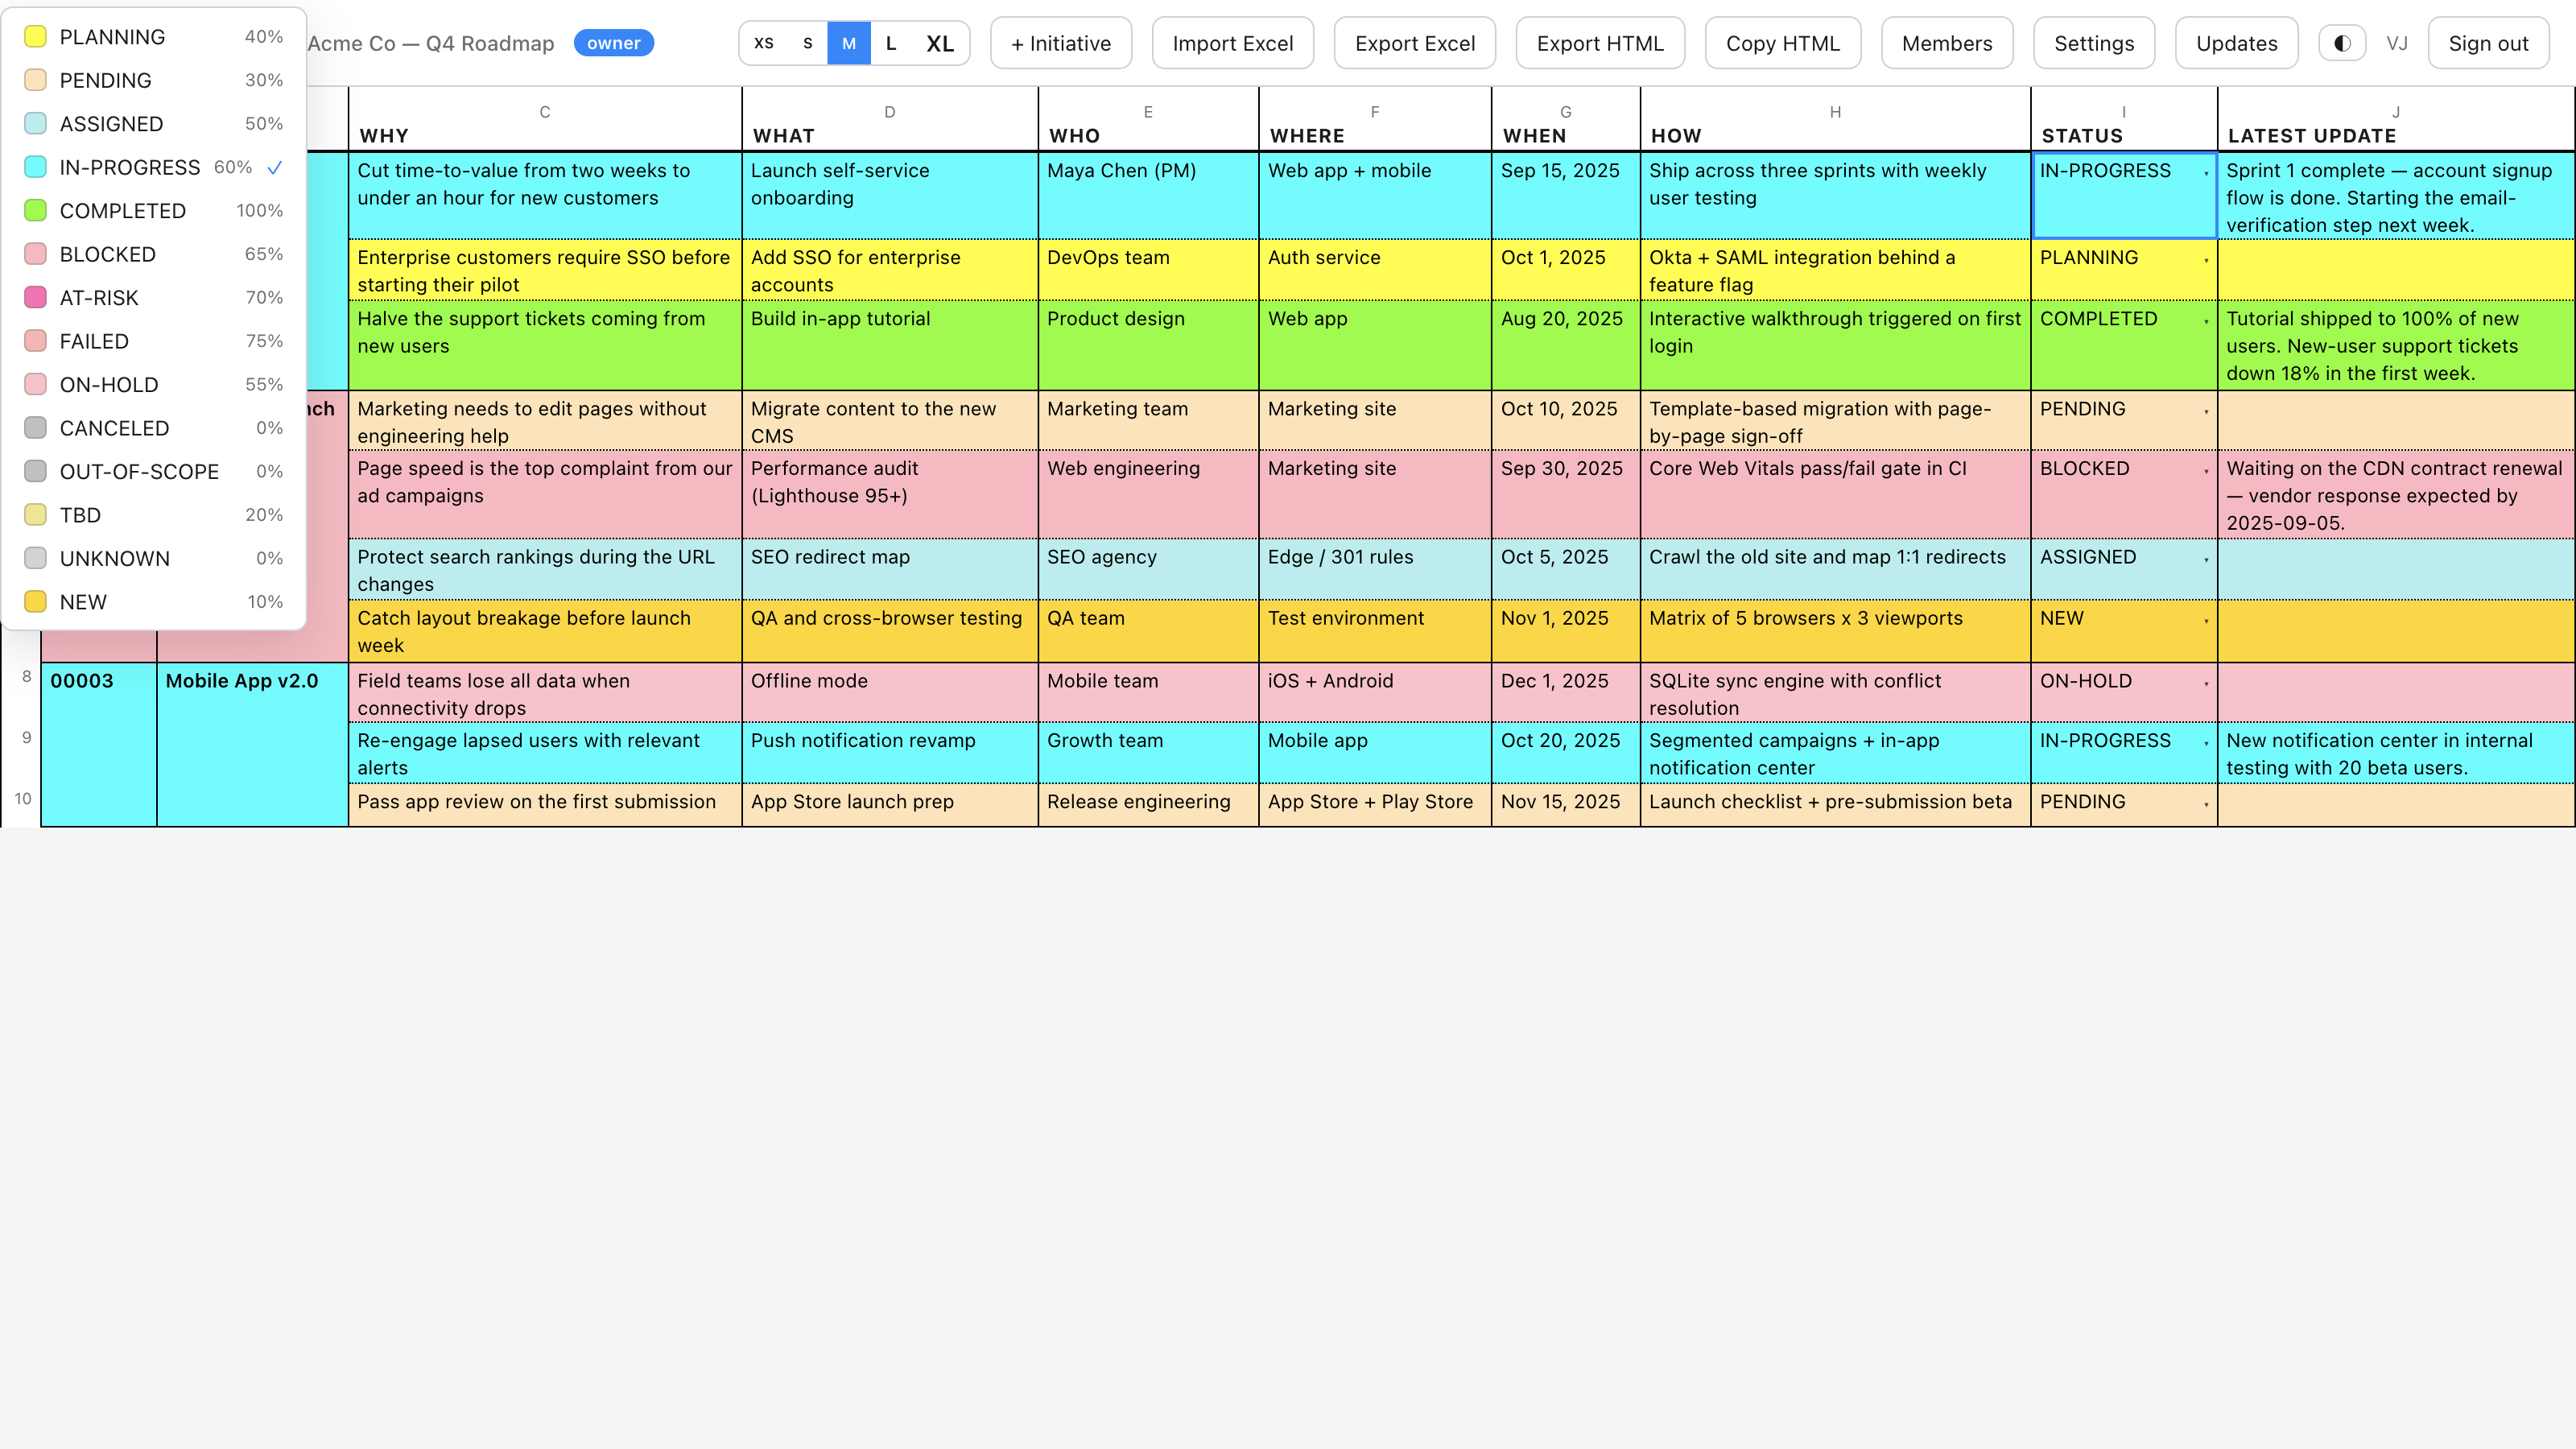
Health at a glance. One click on STATUS opens the full catalog — each status with its tint and health weight, so the grid recolors itself as work moves.
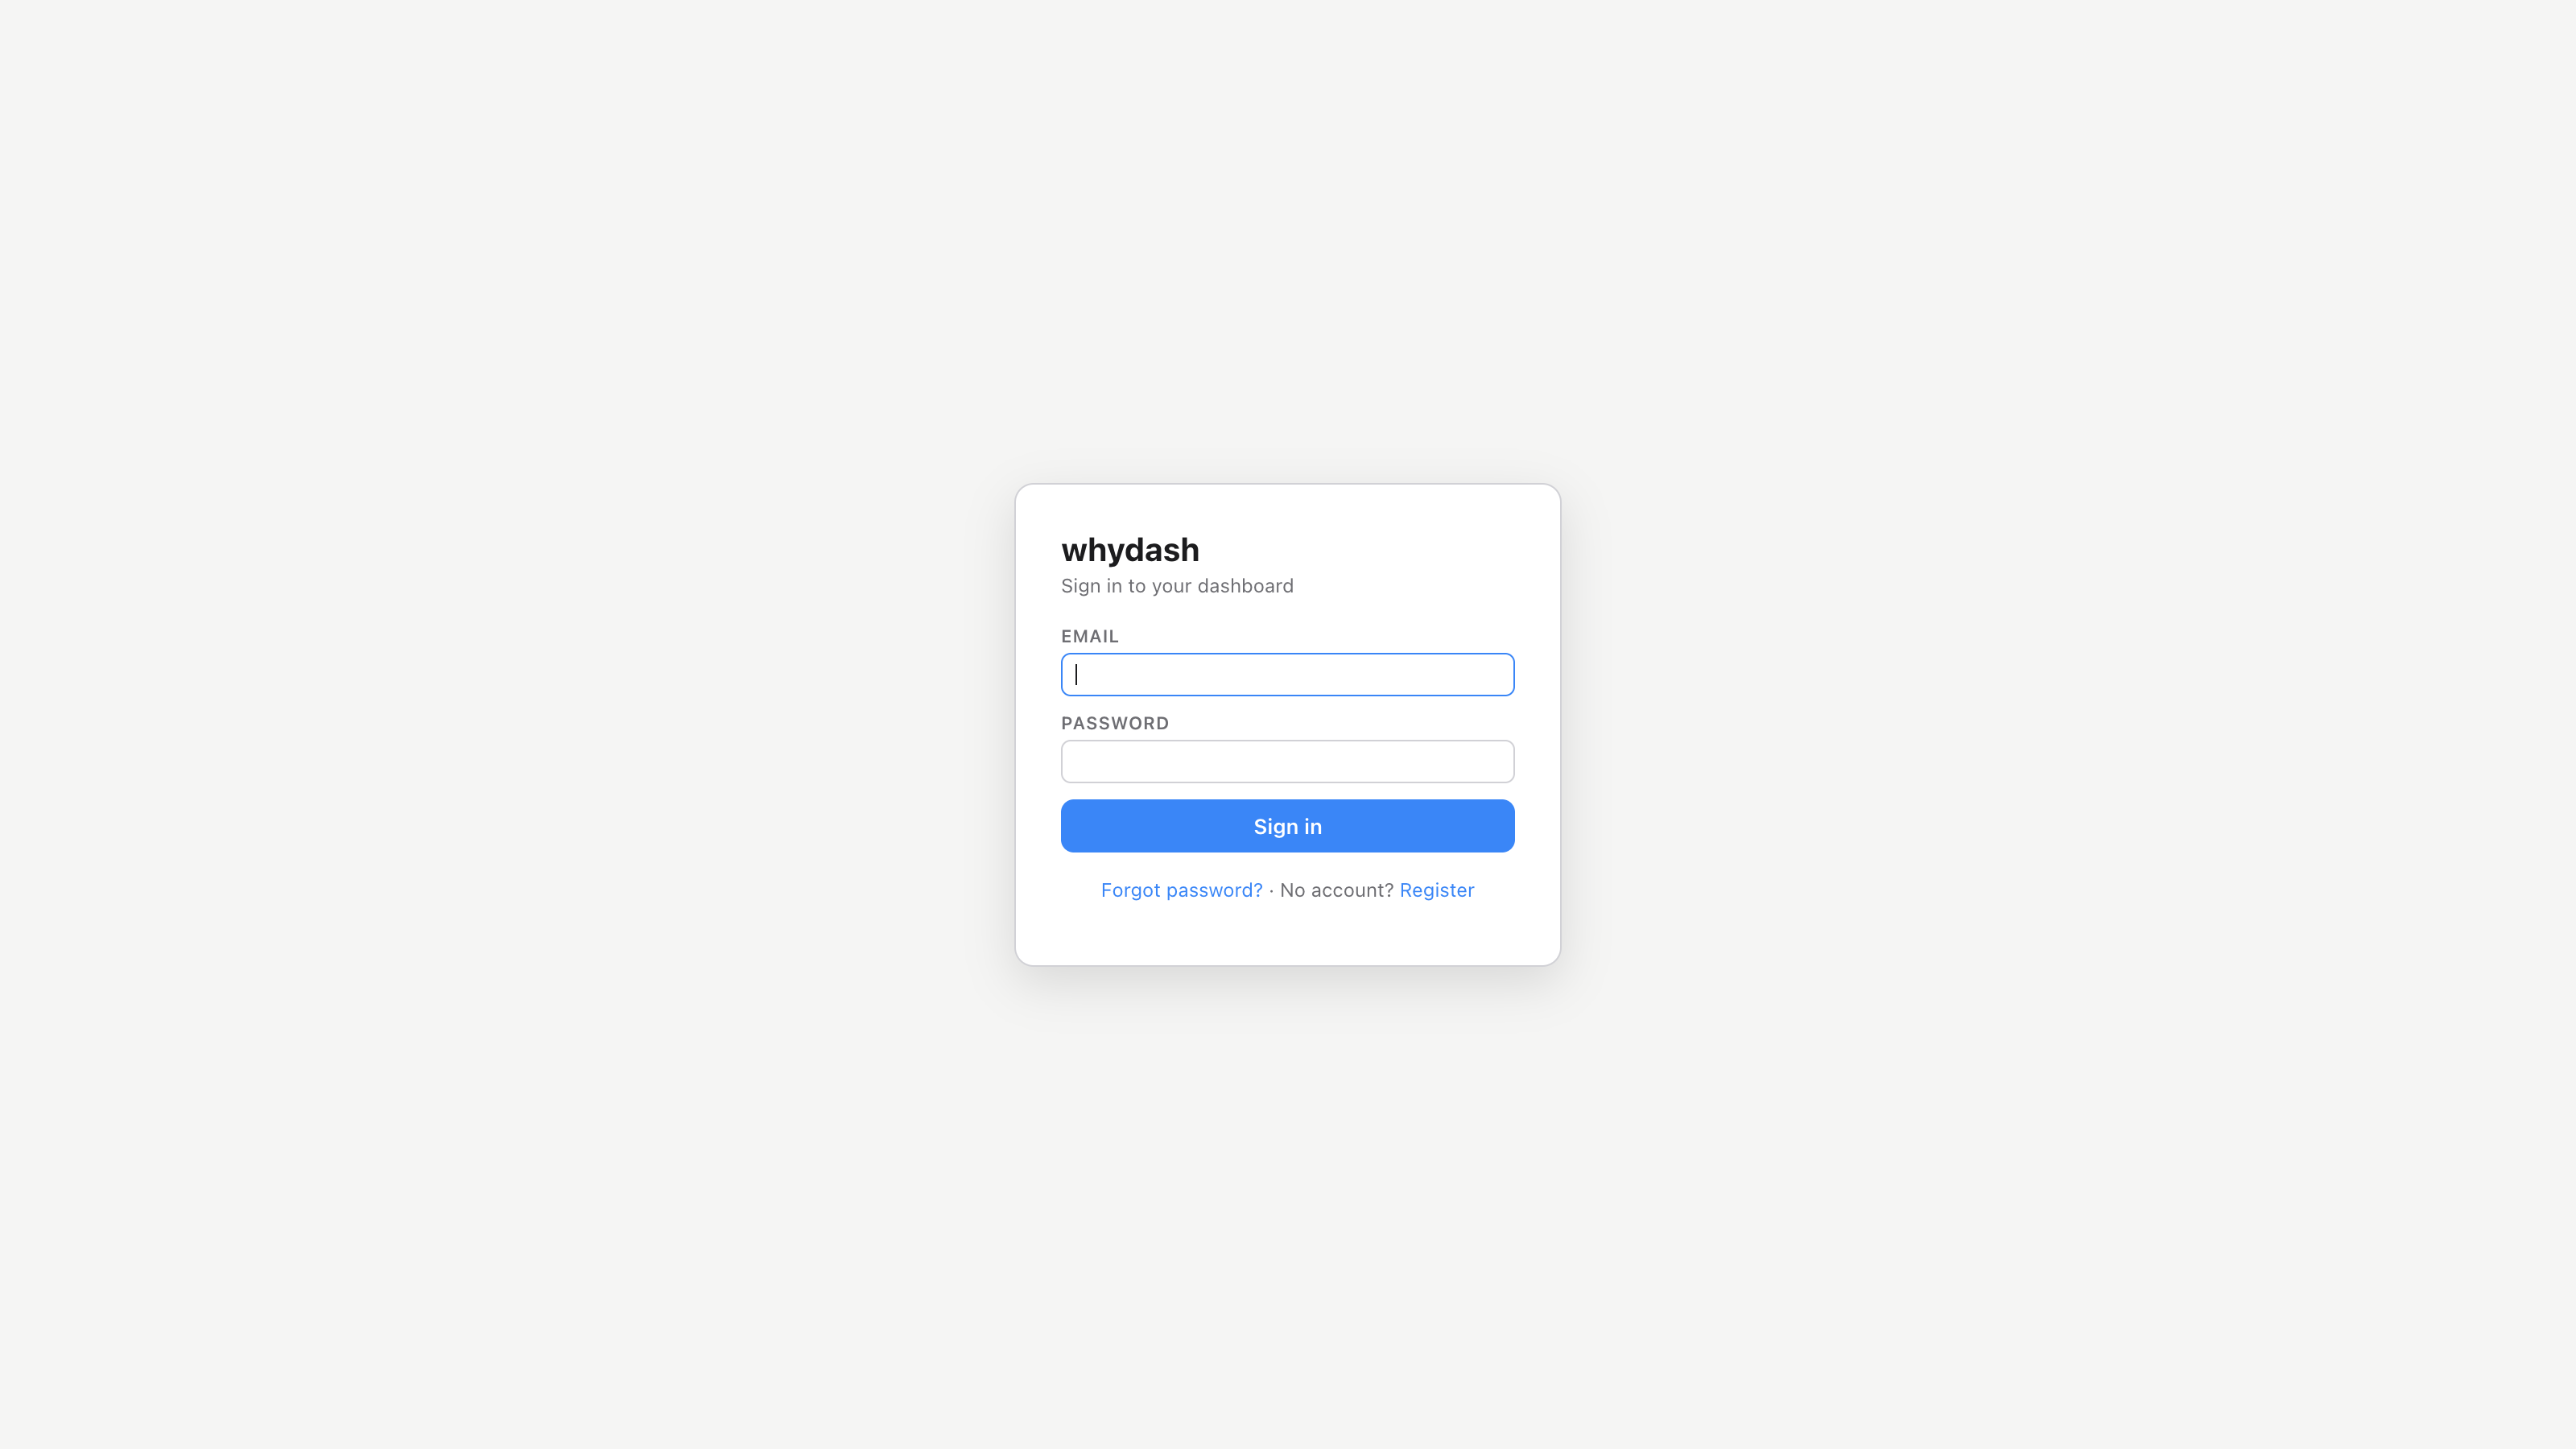
Self-service access. Register with an email, activate through a secure flow, and recover with secret questions — no IT ticket required to get a team onboarded.
Why teams switch
The same grid serves two jobs: keeping a product roadmap honest, and keeping project delivery visible.
For product management
Roadmaps that survive contact with a board meeting.
- Every feature carries its why. The WHY column forces the business rationale into the plan — deprioritizing becomes a conversation, not a fight.
- Portfolio health in seconds. Status tints and health weights turn a 40-row roadmap into a heat map you can read across the room.
- Review-ready by default. The grid is the executive deck — export HTML or XLSX and walk into the quarterly review with the live source of truth.
- Enterprise asks stay visible. SSO, compliance and licensing work lives as first-class rows with owners and dates, not sticky notes.
- Decision history is auditable. Row history records what changed and who changed it — the answer to "when did this become a priority?"
For project management
Delivery tracking without the tooling overhead.
- Owner + due date on every row. WHO and WHEN are mandatory cells, so nothing schedules itself into no-man's-land.
- Blockers surface immediately. BLOCKED, AT-RISK and FAILED tints make problems impossible to hide in a green portfolio.
- Updates as a dated log. The LATEST UPDATE column answers "what changed since the last standup?" without opening a ticketing system.
- Safe to delete. Soft delete with restore, transactional imports, and JSON backups mean a bad day never loses a project.
- Bring your existing logs. Import the RAID-log Excel you already maintain; export back to it when stakeholders ask.
Up and running in three steps
Create your account
Self-service signup with email activation. Every new account starts on a 60-day free trial — single seat, full features, no card required to explore.
Create or import a project
Start blank, or import an existing RAID-log .xlsx and a legacy
.whydash file in one step. Statuses, initiatives, rows and update logs
round-trip exactly.
Invite your team
Invite members by email, assign owner / collaborator / guest roles per project, and run your next review on the live grid — with @mentions routing context to the right people automatically.
Licensing that scales with the team
Two license shapes, one transparent quote. Single seats an owner plus unlimited read-only guests; Team licenses cover 1–10,000 seats with team-admin promotion. Quotes are computed server-side — base, seat band, account discount and upgrade credits, each step itemized. Billing is a recurring subscription: pick monthly or annual, PayPal renews each term automatically, and you can cancel any time from your account — no lock-in. Renewal reminders arrive at days 21, 14, 7, 3, 2 and 1 before expiry, and expired accounts drop to read-only rather than losing data.
Start with the why.
Put your roadmap, your RAID log, and your next review on one color-coded grid — and give every row the dated story of how it got there.
Screenshots show the WHY Dashboard web application with sample data.