WHY Dashboard Help
A practical walkthrough of WhyDashboard — manage your project simply, effectively and continuously, with high accountability and the least amount of paperwork.
In this guide
Commonsense at work
This post walks you through how you can use WhyDashboard to manage a project simply, effectively and continuously. This is the most natural way for you to manage initiatives across the board with a high degree of accountability and the least amount of paperwork.
Start by creating a new project
We create a hypothetical Office rebuild project and work on it as we go. You can work on this solo, or you can get a Team license and get a bunch of team members to collaborate with you on the project. We start with a single-user license, and as we work through, we'll explore how we can structure the project before deciding to invite more users and collaborate.

You'll start with a menu bar on the top, and an empty project. Most of the user interface work is done using the menu, but as you go, you will see that there is a faster way to work, using the right-click context menu within cells so that you can work fast.
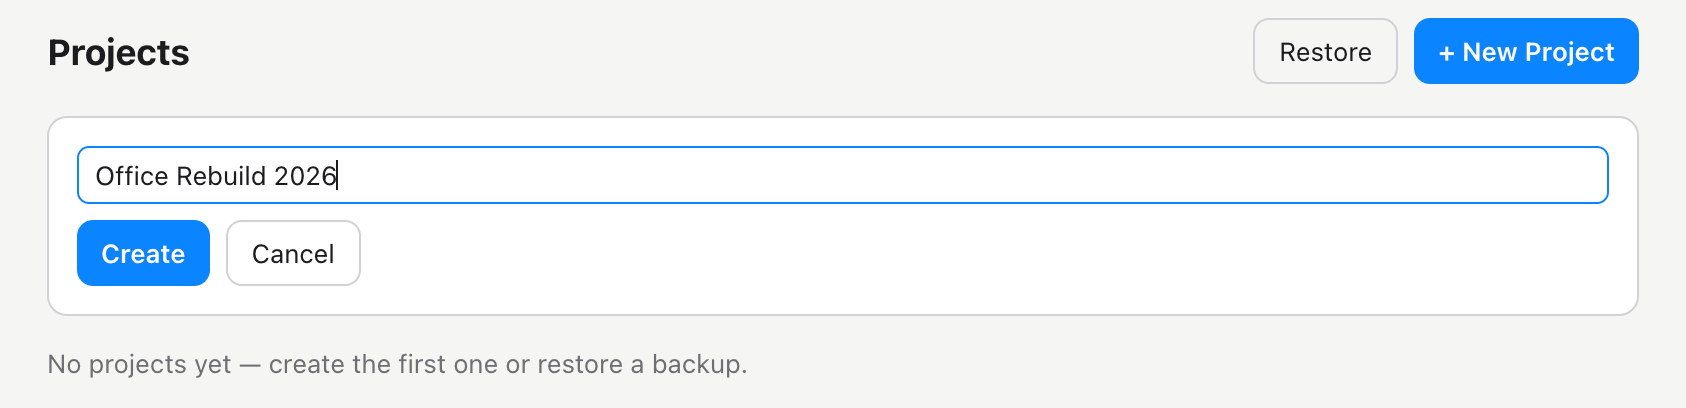
Let us create our first initiative and go from there…

One of the distinctive features is the dynamic layout which fits all the columns in your view so that you are not struggling between readability and scrolling. You will only have to scroll up and down as initiatives pile on, but you will never need to encounter the dreadful horizontal scrolling. Just double-click into the cell with the text “New Initiative” to start editing. The cursor will be positioned at the end of the text, always. You can backspace to erase it's content, and hitting enter, or tabbing or clicking away from the cell will save your changes.


Initiatives can have multiple rows
Each Initiative can have multiple rows, each representing a task that needs to be completed. Each task has a WHY, WHAT, WHO, WHERE, WHEN and HOW, along with a STATUS and always shows the LATEST UPDATE in the grid. There is a panel to your right when you click on any row, to see both all the updates over time and another tab that will show you an audit trail of all changes made over time. Double click on any WHY or WHAT cell under your initiative and start typing. You pick a Date by which you want this task to be completed.
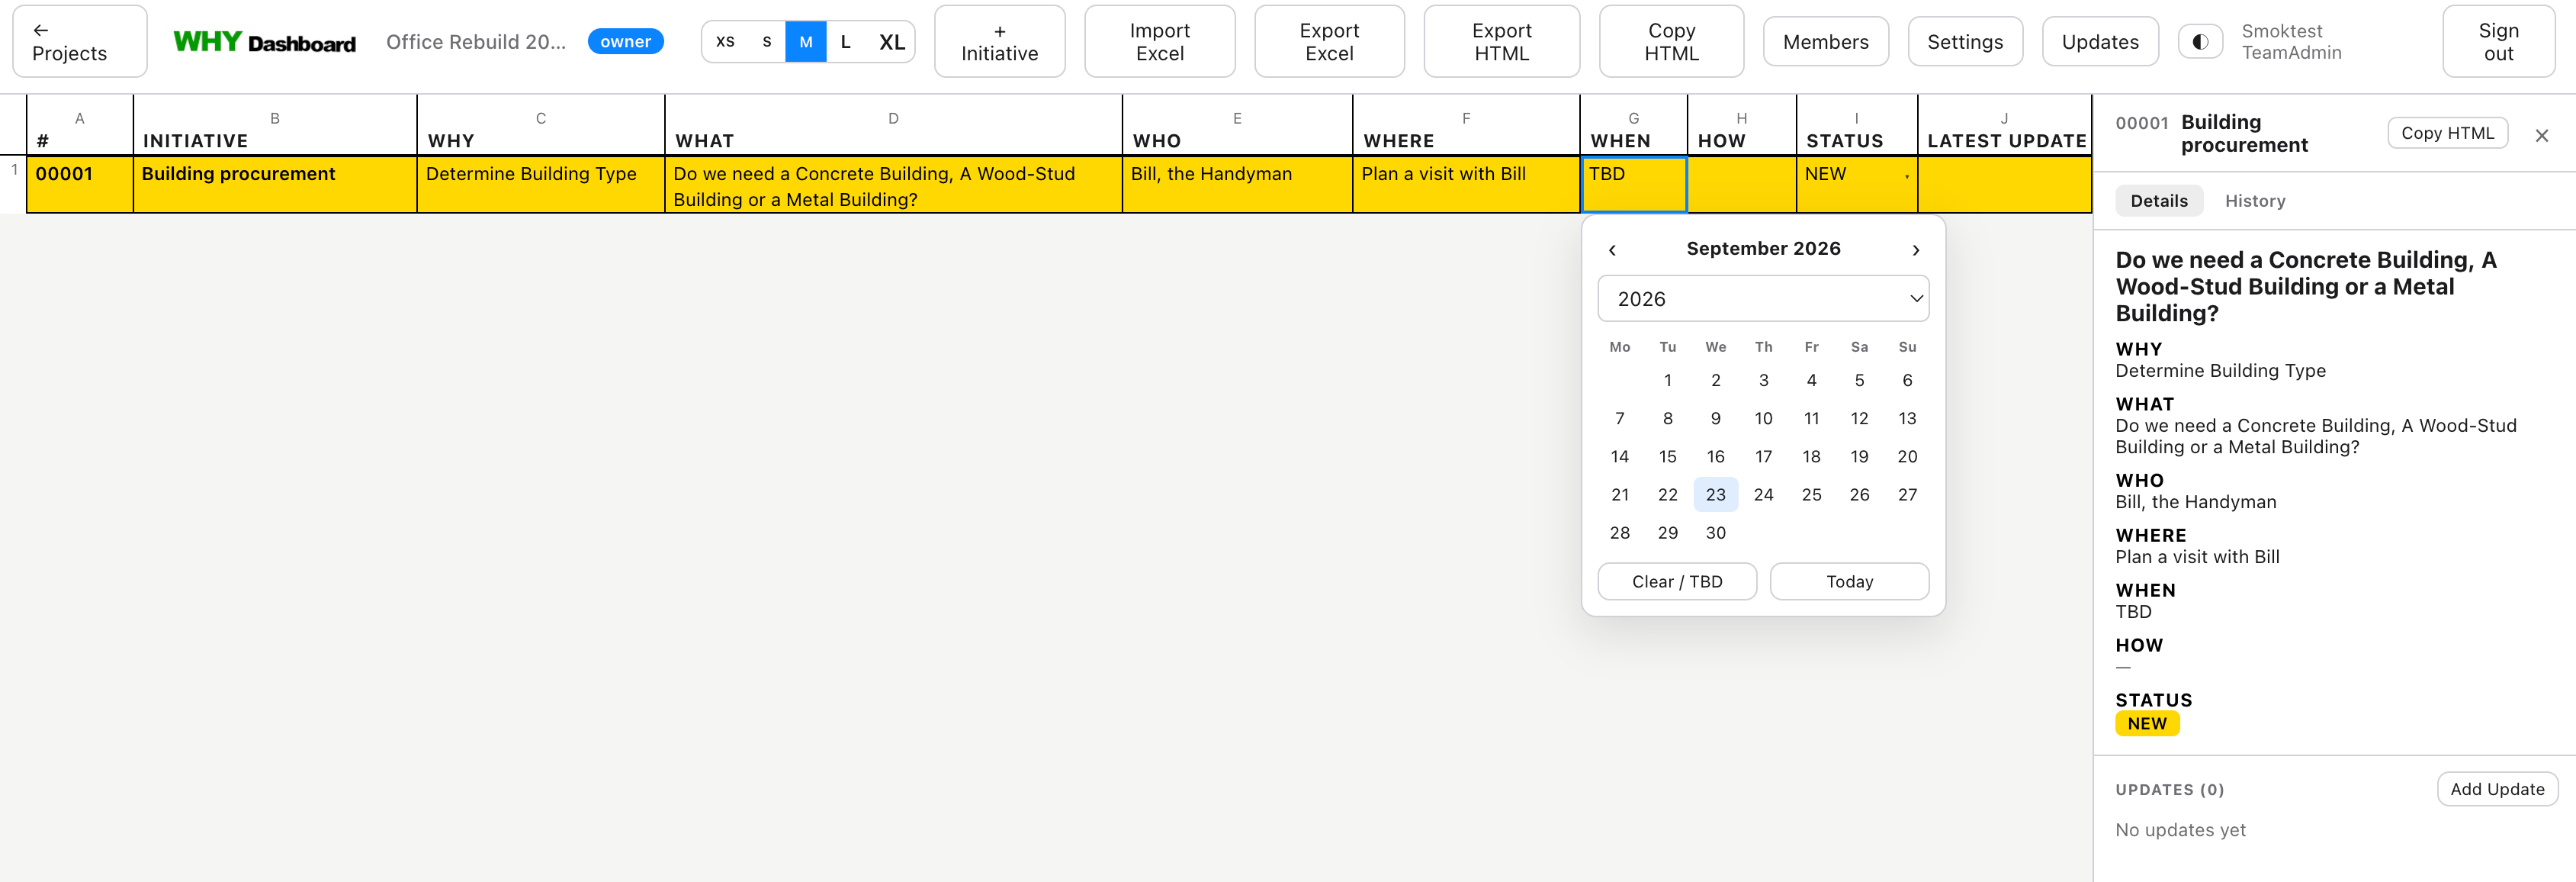
Once you pick a Date, you can manage the status of the task by clicking on the status cell. The statuses are pre-populated.
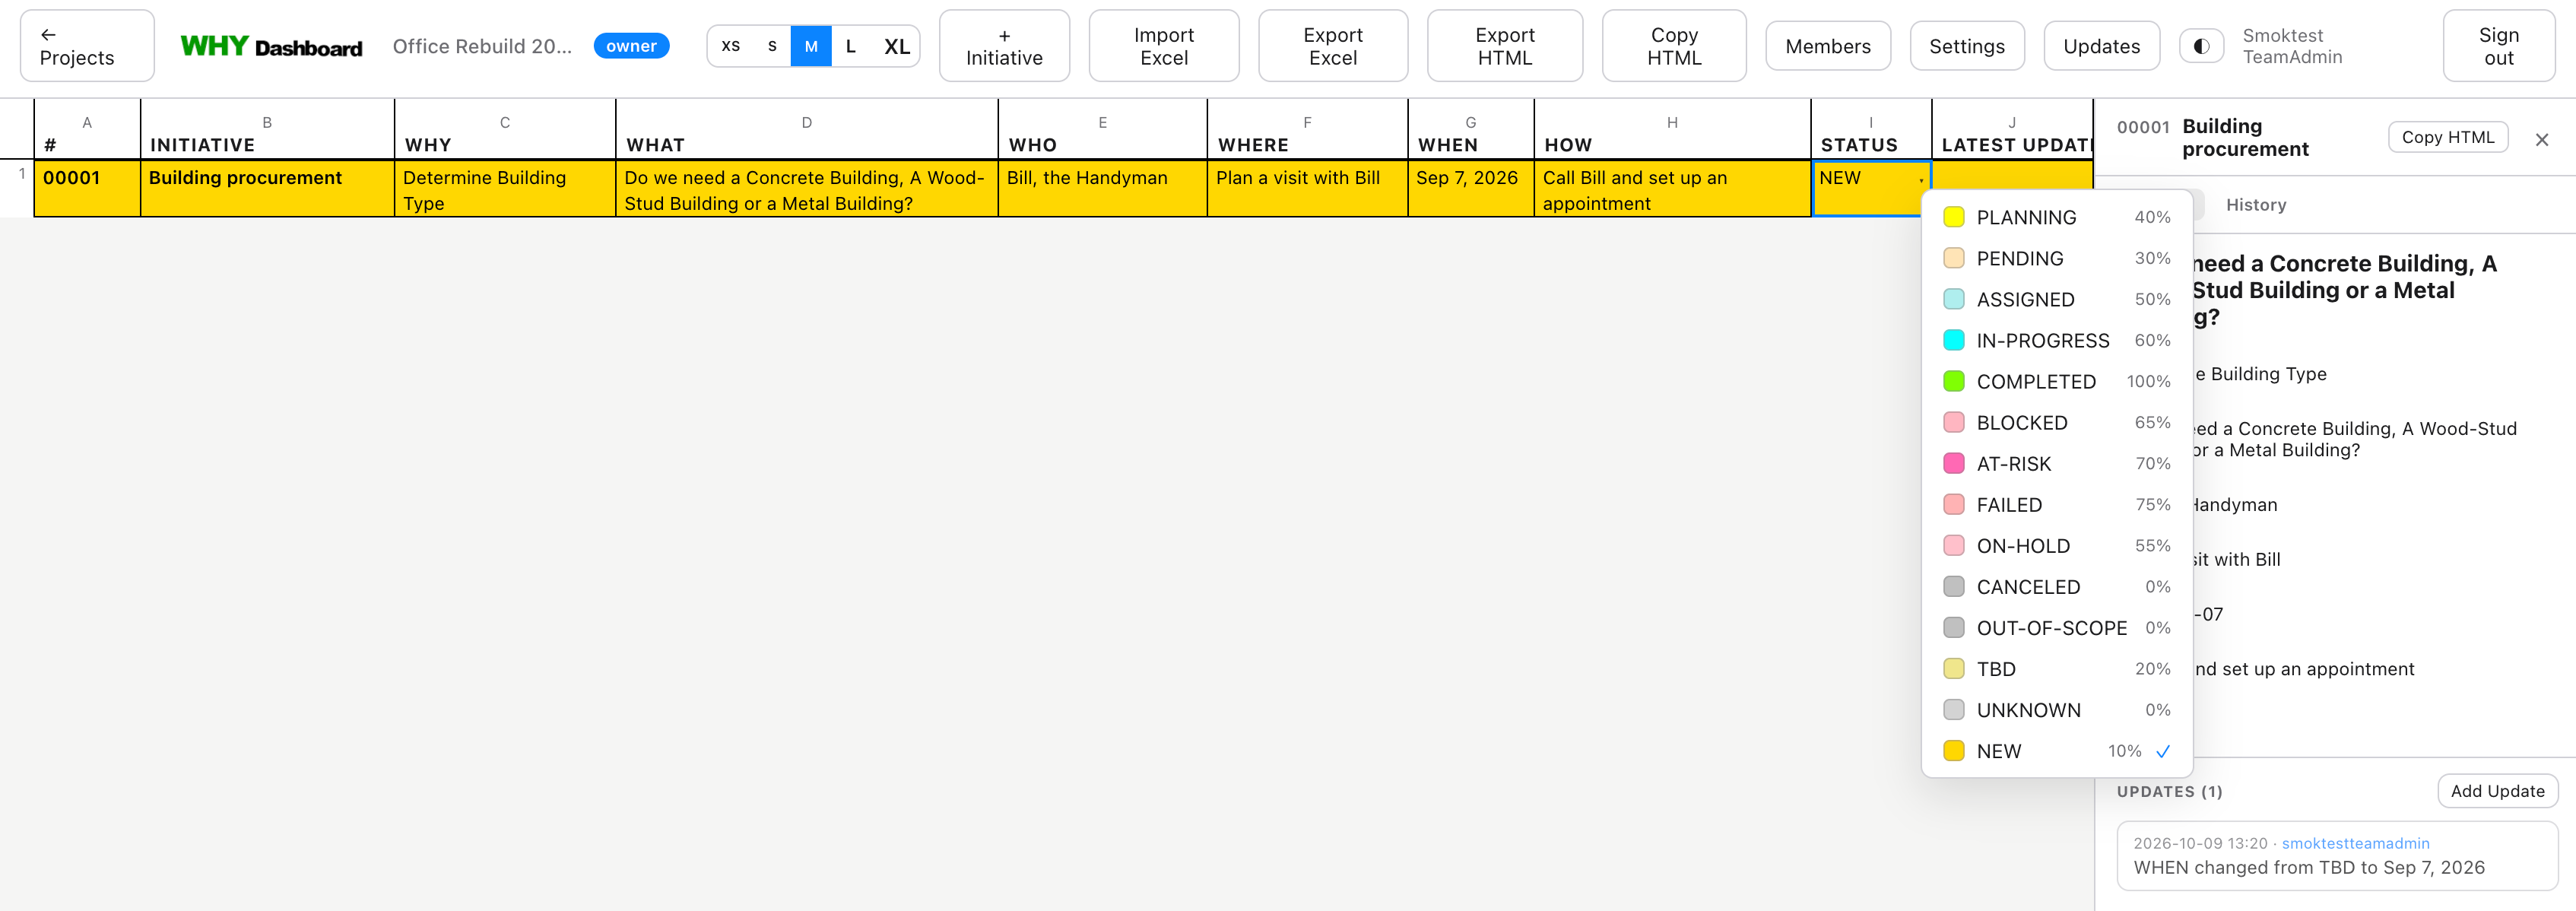
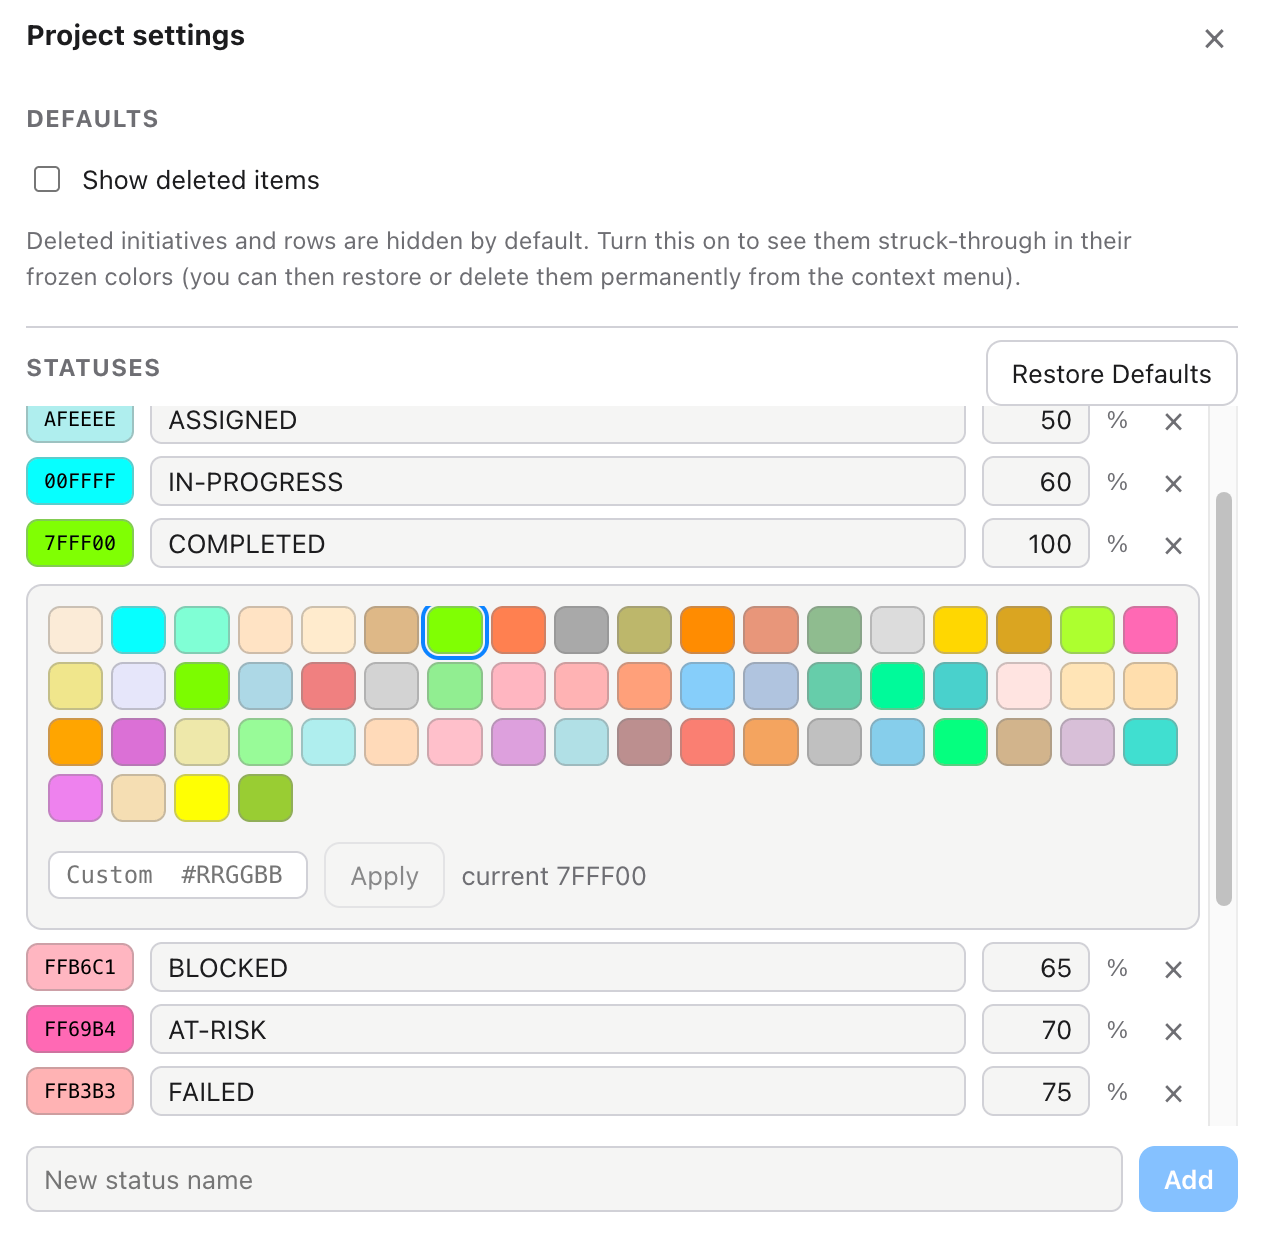
This may seem pretty opinionated, and you can always adjust these statuses and their colors and percentages in the settings screen as shown below. The settings can be customized per project.
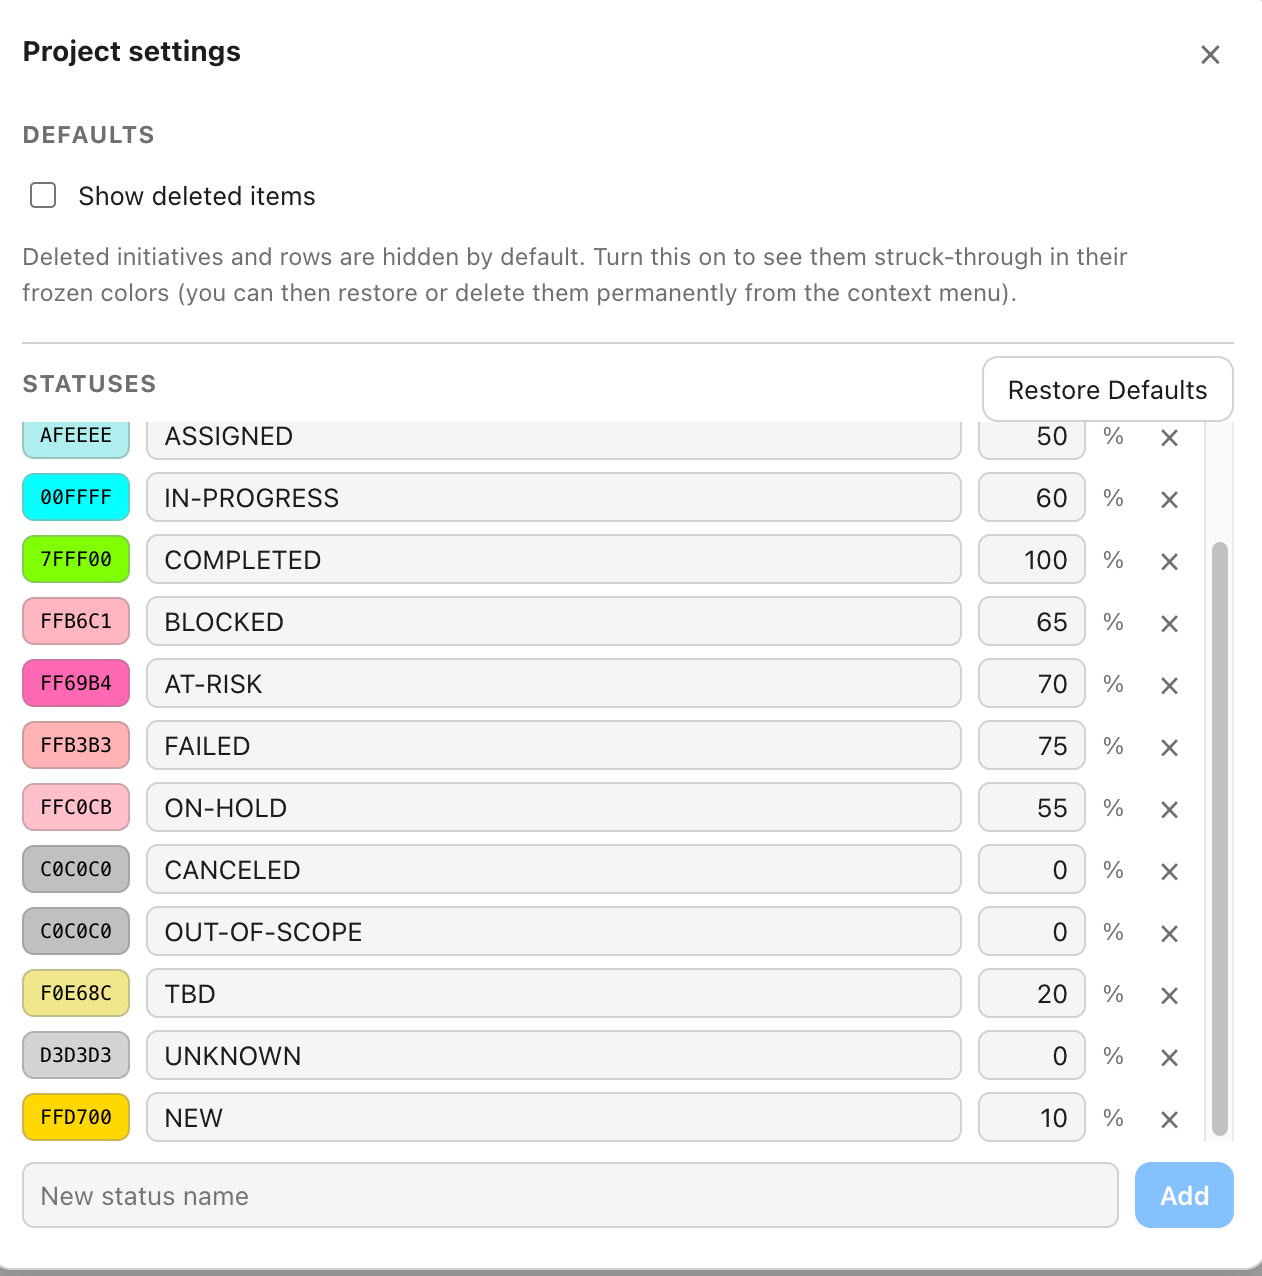
The colors can be customized to your needs as well. But exporting to Excel and HTML is one of our core features, and readability and printability are uncompromised objectives that restricts us to pastel colors. We think this is a feature. As you use the platform, you can decide for yourself and let us know through the feedback hub, if you need something changed.
Adding more initiatives and rows
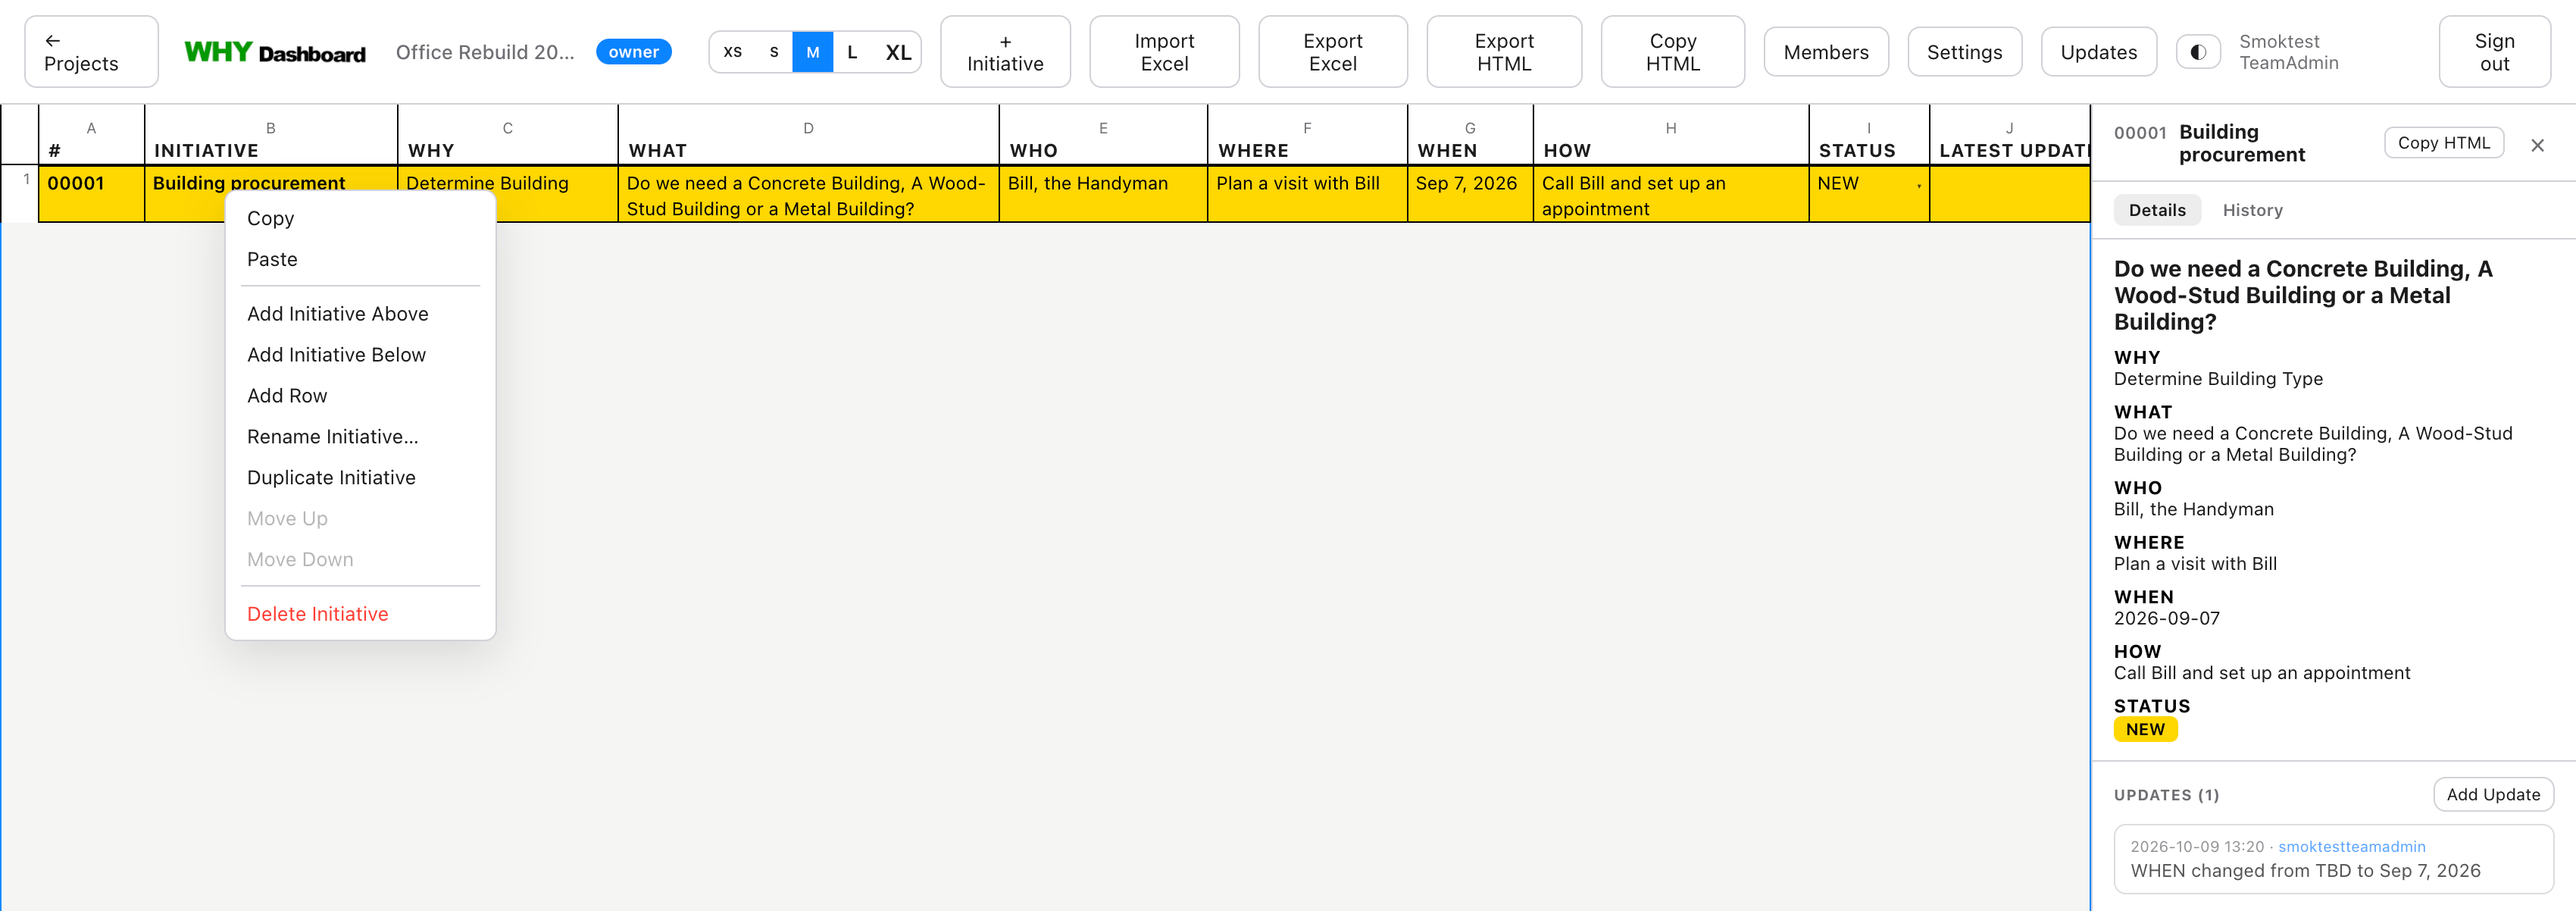
Right-Click the initiative to add rows to it, or add more initiatives as you go on. This context menu is always there when you need it and stays out of the way when you don't to keep focus on the material and not on the user interface.
Let us move on with our hypothetical project, to visualize how the plan can be laid out and executed.
We've made some progress on our project and are getting close to having an initial budget created and tracked as we continue to execute. This looks like a much larger project than we expected.
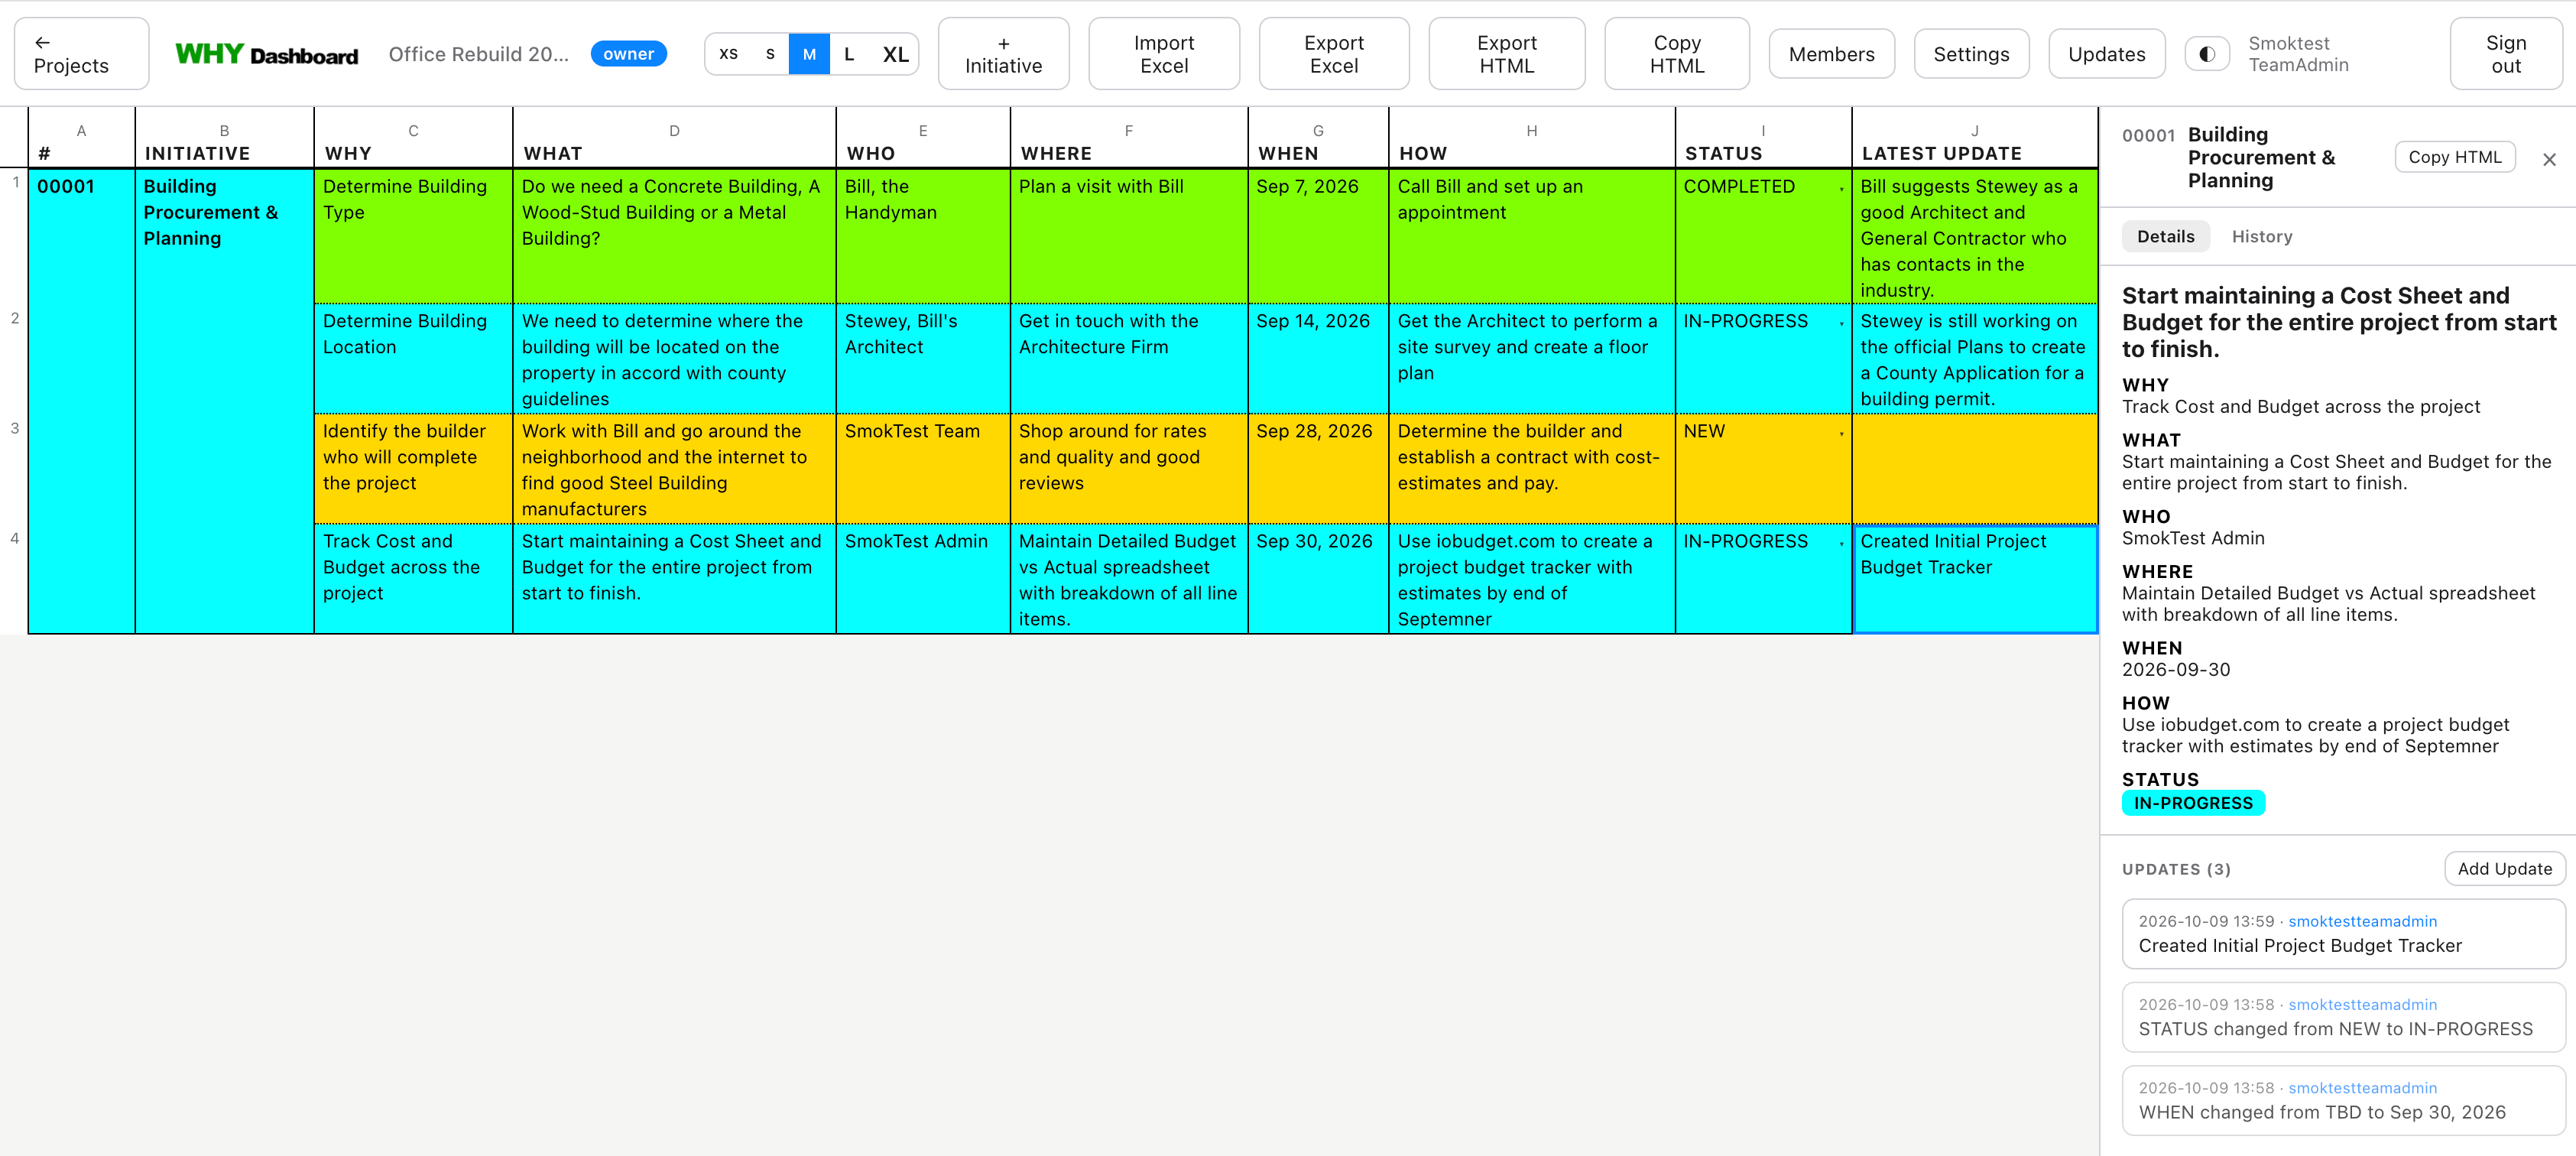
You will notice that the details and History tabs in the inspector view to your right are per-Task. Let's continue to build out the project.
You can always move initiatives up and down and also move rows within an initiative up and down using the context menu as shown below.
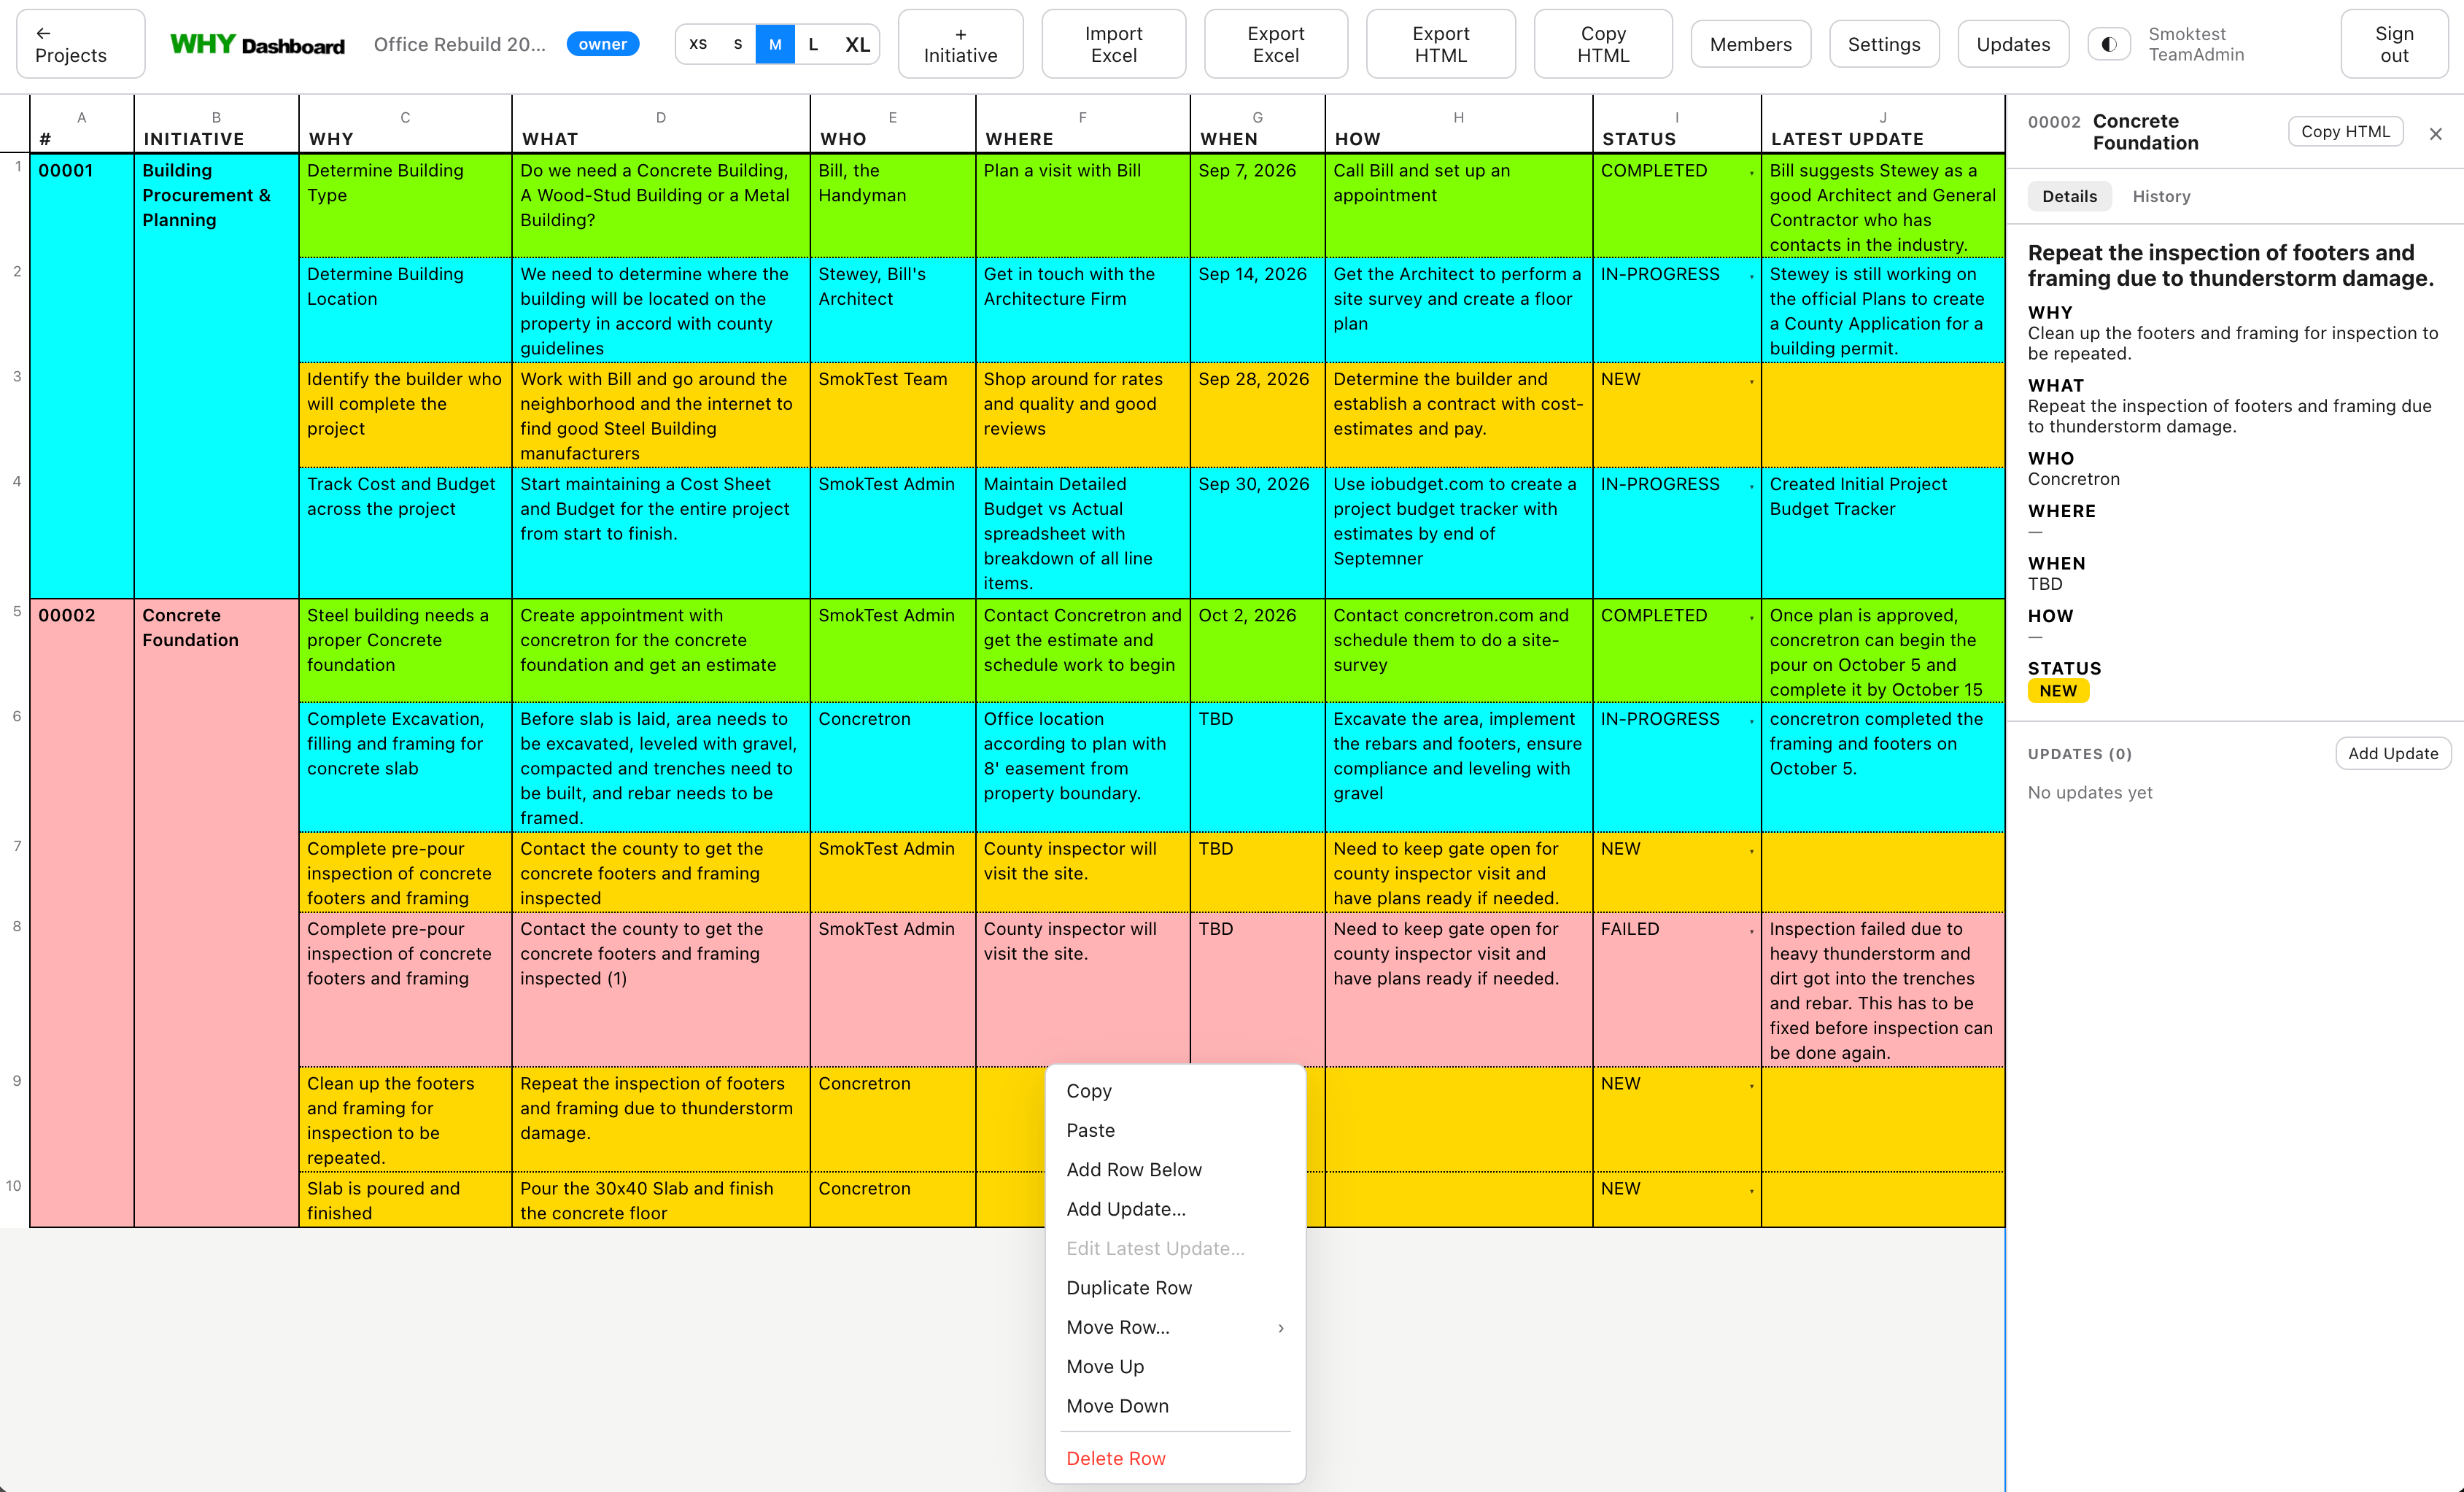
Here is an example of how we've move things around as work goes on.
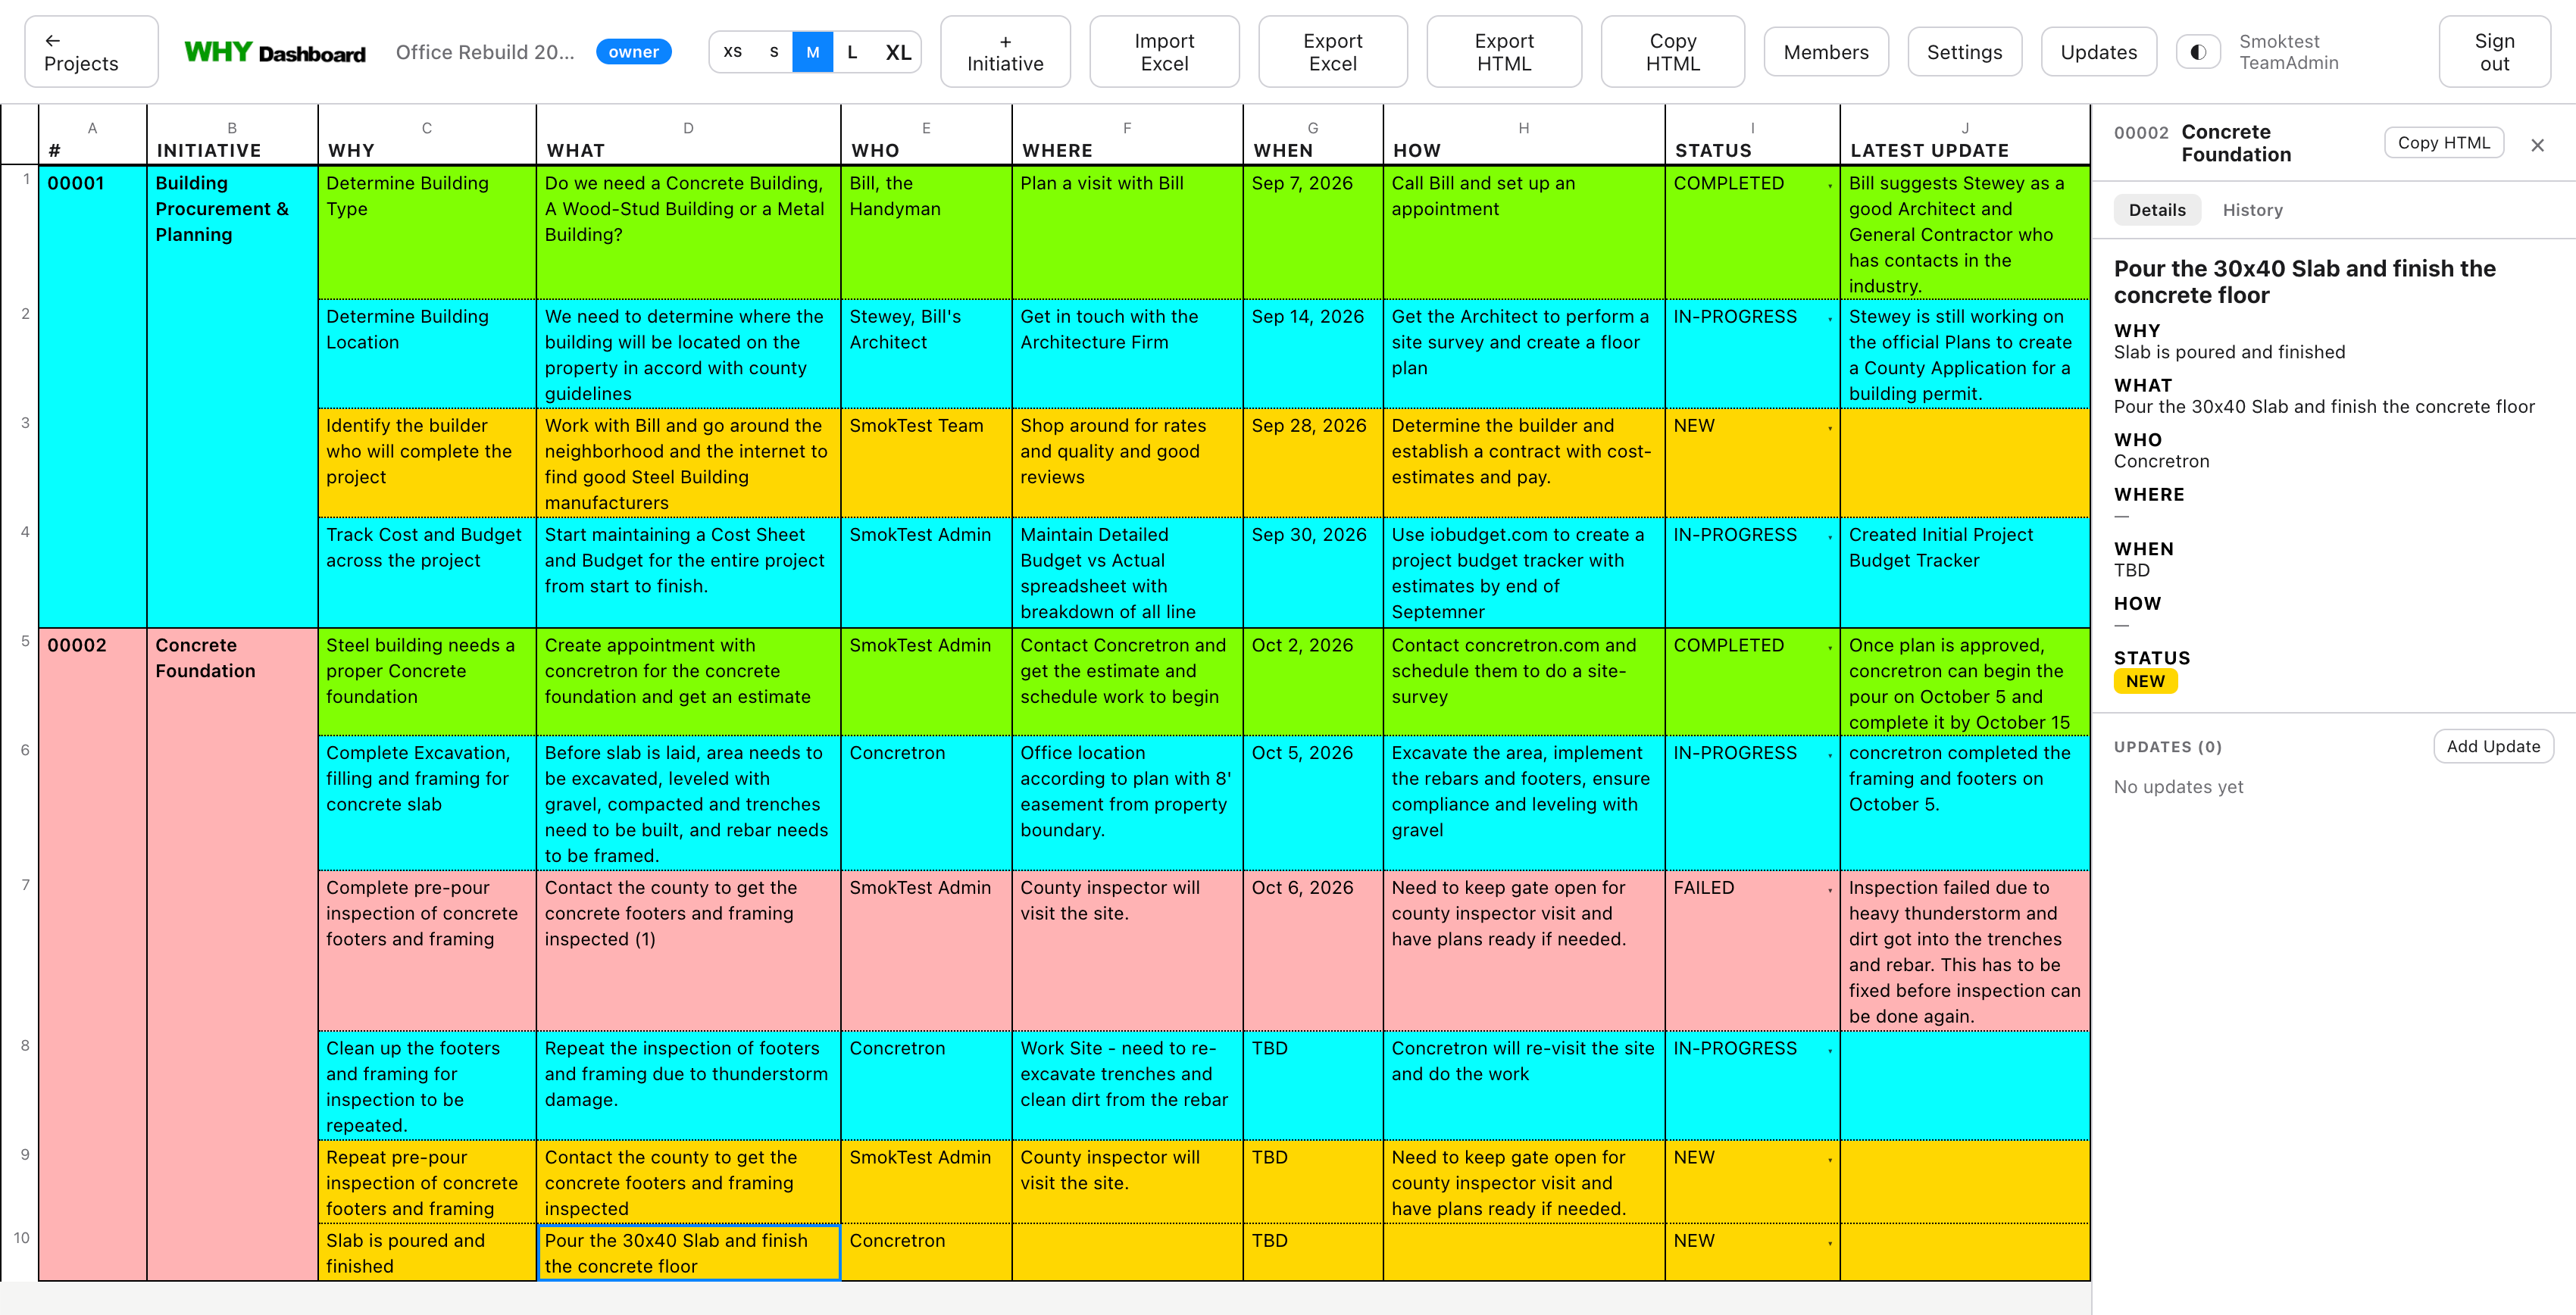
This makes project management intuitive, less of a chore and more natural along how real work happens.
Backups and restores
You can always export this to Excel, and it produces an XLSX worksheet for sharing for non-users or status presentations. You can also copy and paste the entire grid as HTML into an email editor or for web publishing.
You can also import an existing Excel document — the import is somewhat idempotent. Always make sure that the spreadsheet you are importing was previously exported by WhyDash, otherwise you might encounter issues.
It is always recommended to Export your data and documents on the Projects page. You can re-import them using the Restore button on the home page.
Changes you make to an exported Excel spreadsheet will show up as updates when you import the updated Excel spreadsheet in the backup, but depending on the version of Excel, this feature may or may not work. For best results, take a backup of your project and test the behavior before you go overboard with offline Excel edits.